Executive Summary
Small businesses are vital to the U.S. economy. The nation’s 29.6 million small businesses generated over half of U.S. GDP in 2014 while employing nearly half of private-sector employees.1 Starting and growing a business isn’t easy, and access to startup, working and growth capital is a challenge both for entrepreneurs and for the local communities that benefit when small businesses succeed.
While the term “startup” may suggest Silicon Valley and the pursuit of tremendous growth with investment from venture capitalists, most small businesses don’t fit or pursue that model. Instead, the majority of startup small businesses are involved in providing services and rely on the personal savings of the founders and their family. In 2015, startups relied on bank loans 8% and business credit cards 2% of the time. And while 57% of small businesses did not expand, 22% expanded with personal and family savings, while venture and angel capital accounted for less than 2% of financing.2 Bank loans and business credit cards are more common sources of financing than venture capital, providing 5% and 2% of capital for established and expanding small businesses.
Banks play an important role in financing small business growth, yet the data on bank lending is limited. In 1977, the Community Reinvestment Act (CRA) required banks to report on the amount of small business lending to neighborhoods at different income levels in counties across the country. This was done to provide oversight and correct for a history of discriminatory lending practices against low-income and minority neighborhoods, commonly referred to as “redlining.” While the CRA small business data provided some insight into lending patterns in low-income areas, it didn’t provide data on the income or minority status of business owners. The only other publicly available data on small business lending comes from the small percentage of business loans backed by the Small Business Administration (SBA) 7(a), which comprises only 3% to 7% of small business loan volumes.3 This lack of data cloaks bank small business lending practices, hindering regulators’ and stakeholders ability to monitor and hold banks accountable.
To dig deeper, the National Community Reinvestment Coalition (NCRC) took two approaches. First, it used publically available data on small business lending to analyze bank lending practices from 2008 to 2016. Then, NCRC used mystery shoppers to examine differences in the customer service experiences for potential borrowers of different races in Los Angeles in 2018.
The data and tests revealed a troubling pattern of disinvestment, discouragement and inequitable treatment for black and Hispanic-owned businesses.
This study found from 2008 to 2016:
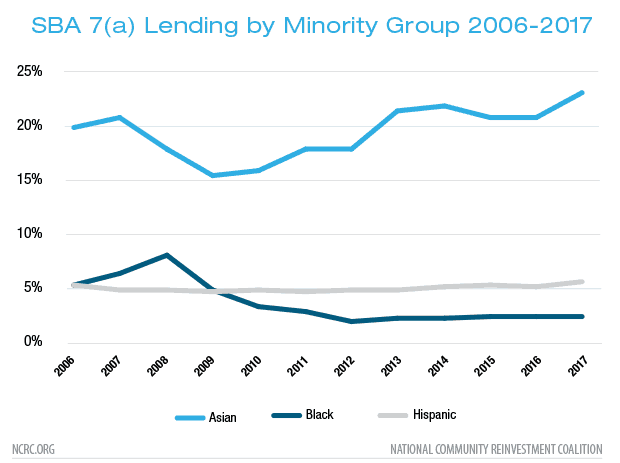
- There were steep reductions in SBA 7(a) lending to black small business owners. This resulted in a decline from about 8% to 3% of loans during the Great Recession, a decline that has yet to recover.
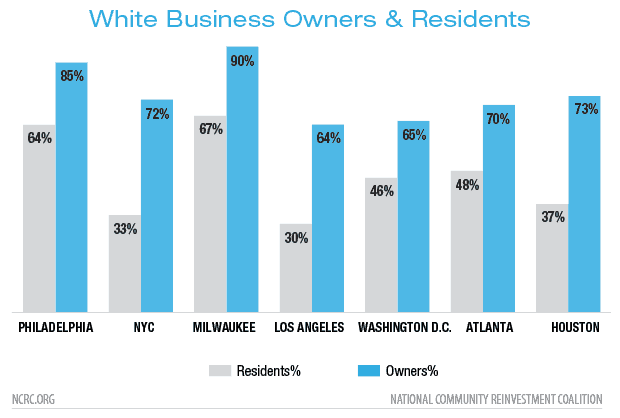
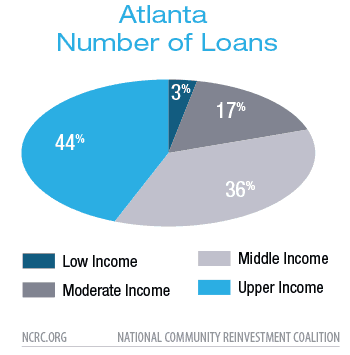
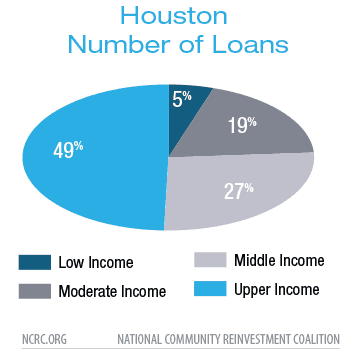
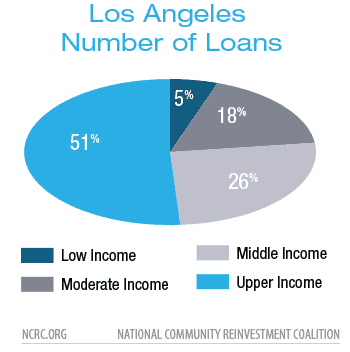
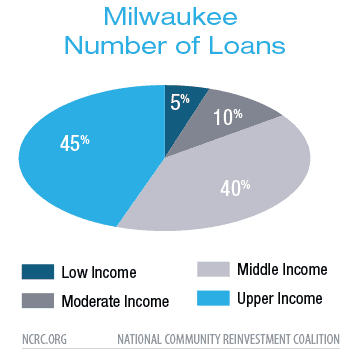
- Business owners in wealthier areas received the largest share of loans – 85% in Milwaukee. In fact, in six of seven metro areas analyzed, more than 70% of loans went to middle- and upper-income neighborhoods.
- The number of bank branch locations declined 10% since 2009, likely affecting small businesses that are highly dependent on local-level banking relationships.
- Banks have not reinvested the increased capital that they accumulated through deposits after the end of the Great Recession back into small businesses. The most significant difference between deposits and loans occurred in New York City metro area, where deposits increased by 100%, but lending decreased by nearly 40%.
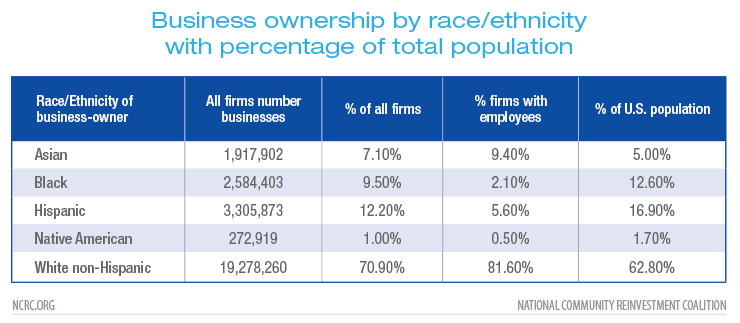
- There are tremendous gaps in black and Hispanic business ownership relative to their population size. Although 12.6% of the U.S. population is black, only 2.1% of small businesses with employees are black-owned. Hispanics are 16.9% of the population yet own only 5.6% of businesses.
Mystery shopping tests in 2018 revealed:
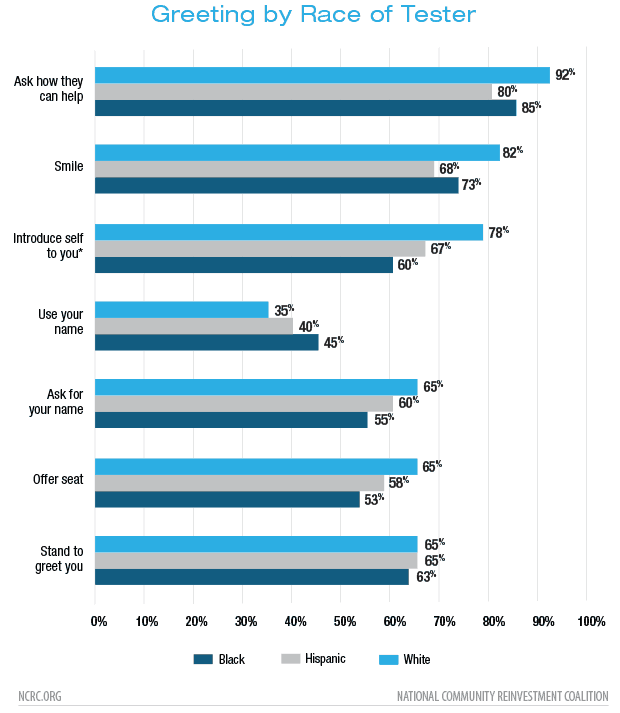
- Bank personnel introduced themselves to white testers 18% more frequently than they did to black testers. White testers received friendlier service overall.
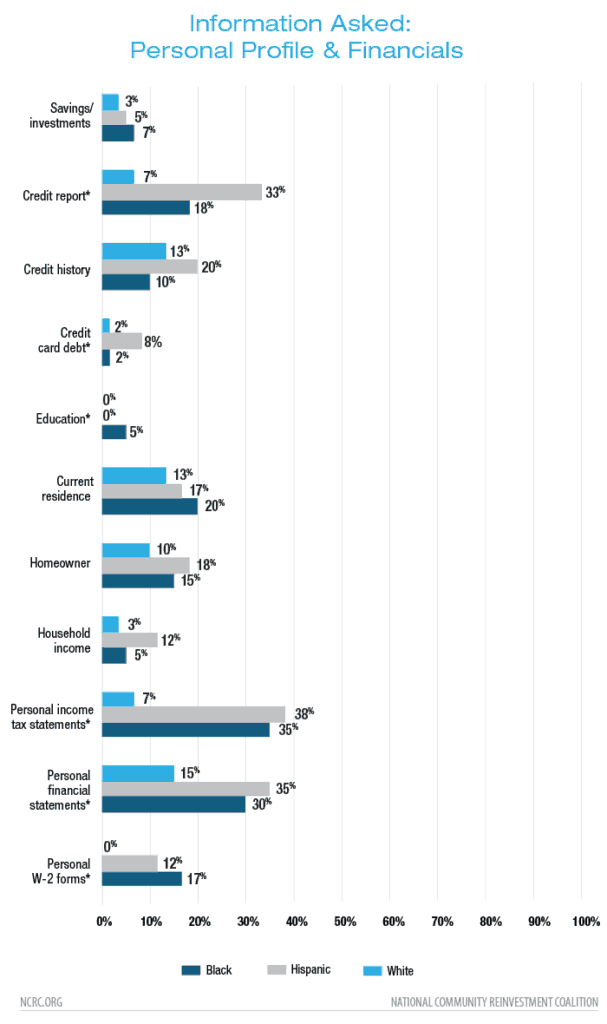
- Black and Hispanic testers were requested to provide more information than their white counterparts, particularly personal income tax statements where Hispanic testers were asked to provide them nearly 32% and black testers 28% more frequently than their white counterparts.
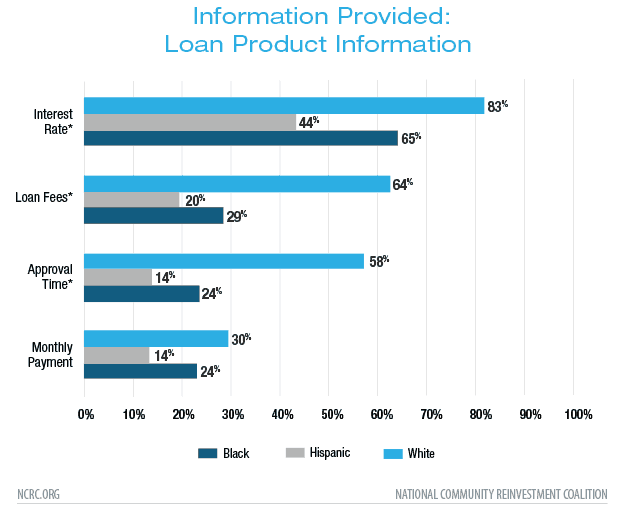
- White testers were given significantly better information about business loan products, particularly information regarding loan fees where white testers were told about what to expect 44% more frequently than Hispanic testers and 35% more frequently than black testers.
- One area of customer service was significantly better for black and Hispanic testers – they received an offer to schedule an appointment to take their application more often, which happened 18% more frequently for black testers and 12% more often for Hispanic testers.
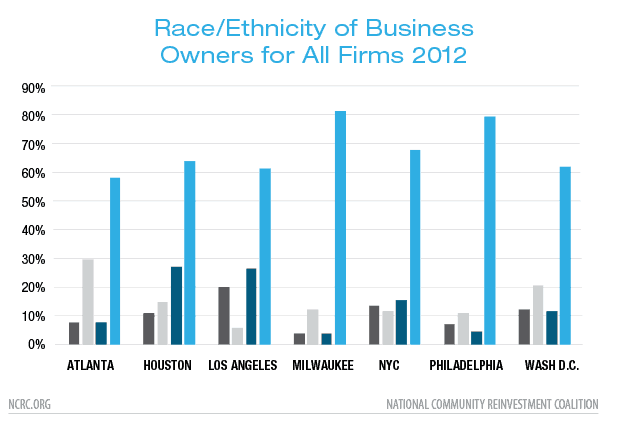
The analysis of lending practices used data reported by banks from seven U.S. cities: Atlanta, Houston, Los Angeles, Milwaukee, New York, Philadelphia and Washington, D.C. The limited data that banks are required to report on their small business lending show low levels of participation in entrepreneurship and lack of access to capital through the traditional banking market, especially for black and Hispanic business owners. In all seven cities, non-Hispanic white and Asian small business ownership is robust, while black and Hispanic small business ownership lags in comparison to their share of the population. The racial business-ownership divide is particularly pronounced when examining businesses with employees. This indicates that the benefits of small business growth in providing employment opportunities in minority communities are not being realized.
NCRC’s findings show large gaps in black and Hispanic entrepreneurship when compared with Asian and white business owners. This gap is one of the fundamental causes of the racial wealth divide within the United States. The accessibility of credit is essential to establish and grow small businesses, yet lending to borrowers located in black and Hispanic neighborhoods severely lags. With the paucity of small business data, it is difficult to assess individual bank performance in small business lending. Failure to implement Section 1071 of the Dodd Frank Wall Street Reform and Consumer Protection Act(Dodd Frank Act) hampers the ability of regulators and the public to comprehensively understand whether capital is allocated in an equitable way to women-owned and minority-owned small businesses, a critical component to the operation of a modern economy.
NCRC’s mystery shopping tests indicated that while the customer service experience of all applicants for small business credit is poor, it’s even worse for black and Hispanic applicants. Despite the minority prospective customers’ superior business profiles, they were asked to provide more documentation and given less information about loan terms than their white counterparts. This points to severe gaps in the training provided by banks to their small business lending specialists which can lead to inequities in service to borrowers and deter minorities from even considering getting a loan from traditional banking sources.
INTRODUCTION
While many view homeownership as one of the principal ways to build wealth,4 small business ownership can provide opportunities for people to increase their income, independence and ultimately their economic freedom. This is especially true for minorities, women and immigrants who might not otherwise be able to move into the mainstream economy.5 In addition to wealth-building, small businesses drive economic growth, create jobs and have the ability to revitalize the economy.6 From 1992 to 2013, small businesses7 accounted for 63.3% of net new jobs.8 In the early 2000s, minority-owned businesses employed more than 4.7 million people with an annual payroll of $115 billion.9 Small businesses increase local employment opportunities, provide goods and services to local residents and generate higher levels of income growth within neighborhoods.10
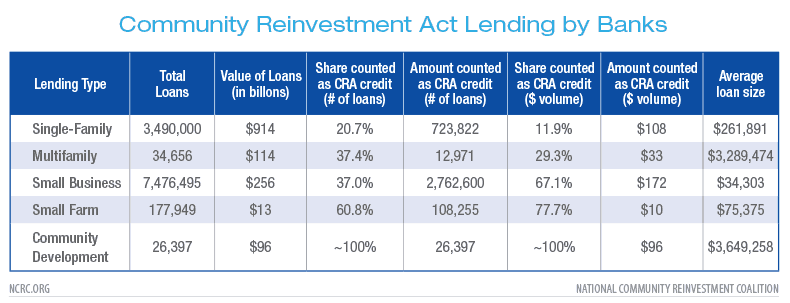
Access to responsible, affordable capital is essential for small businesses to operate and expand. Adequate capital enables owners to hire more workers and make other investments to scale-up and improve business operations as demand increases. According to the 2018 Small Business Credit Survey, traditional bank lending continues to be the primary source of funding for small businesses.11 In turn, banks rely heavily on small business loans to meet their obligations under CRA. Sixty-seven percent of small business loans (7.5 million loans valued at $256 billion) qualify for CRA credit (compared to just 12% of single-family mortgage loans).12 The steady hikes in interest rates by the Federal Reserve makes small business loans increasingly profitable while still enabling banks to offer the lowest interest rates and best term lengths.13
Despite their importance in the economy, small businesses, particularly black and Hispanic-owned small businesses, face many barriers. This is reflected in lower rates of business ownership among minorities. The last U.S. Census Survey of Business Owners (SBO) shows that while the black population comprises 12.6% of the total U.S. population, they make up just 9.5% of all business owners and own just 2.1% of firms with employees.14 This contrasts with the white non-Hispanic population who comprise 62.8% of the U.S. population, own 70.9% of all businesses and 81.6% of the firms with employees. There is a wide disparity in both the revenue and size of black and Hispanic-owned businesses when contrasted with other groups.15 These low rates of business ownership and size, along with other factors, such as lower rates of homeownership, contribute to the widening wealth gap between minority groups and the white non-Hispanic population.16
Current data provide little insight into the small business lending market. Unlike mortgage lending, banks are not required to collect or report comprehensive data on individual business loans. The only publicly available data with an annual reporting criteria is CRA reporting data, which is aggregated, and data on the small number of loans backed by the SBA. There are limited data releases made by the SBO and Federal Financial Institutions Examination Council (FFIEC). None of these sources provide comprehensive information about individual loans, total investment or the demographics of borrowers. Congress recognized this problem following the 2008 financial crisis with the passage of the Dodd-Frank Act.17 Section 1071 of the Dodd-Frank Act called for banks to start collecting and reporting on information concerning credit applications made for small business loans. However, the Consumer Financial Protection Bureau (CFPB), the agency responsible for implementing these reporting requirements, has yet to move forward with implementation and does not appear to have any plans to do so in the near future. Section 1071 would provide valuable insight for understanding this nebulous market and enable regulators and stakeholders to hold banks accountable for their small business lending practices.
In addition to the lack of insight into the overall lending market, the experiences of small business owners who are attempting to access capital in the traditional banking marketplace are not well known. A 2016 survey by the Federal Reserve Bank18 found that the majority of small business owners (55% of those surveyed) did not even attempt to apply for credit. One of the leading reasons for this was “discouragement,” meaning they did not apply for financing “because they believed they would be turned down.” Another Federal Reserve Bank study found that 22.2% of minority neighborhood businesses were discouraged borrowers, compared to 14.8% of businesses from other urban localities.19 The banking experience matters. When small business owners face poor customer service and lack of information, they turn to alternative sources of funding to grow their businesses. These alternative sources of credit, like online lending, could further hinder a small business’s ability to flourish since alternative sources are often unregulated and could lead to higher interest rates and predatory loan terms.
In this report, NCRC utilized the limited publically available data to conduct a seven-city survey in an attempt to get a baseline understanding of how lending institutions are investing in small businesses. The analysis of lending practices used data reported by banks from Atlanta, Houston, Los Angeles, Milwaukee, New York, Philadelphia and Washington, D.C. Despite the increase in overall deposits throughout the seven cities, the volume and amount of small business loans reported by banks under the CRA stagnated in all but one market, Houston. NCRC also conducted small business lending mystery shopping at banking institutions in Los Angeles to gain a better understanding of the level of customer service business owners encountered in the traditional lending market.
Literature review: Racial bias in the financial market
The history of racial bias in mortgage and small business lending industry is well documented.20 The disparity in financial access is rooted in segregationist and discriminatory practices such as redlining and steering. This history of discrimination impeded the full economic participation of minorities and served as the motivation for the Fair Housing Act of 1968 and for the enactment of CRA in 1977.21
Despite efforts to correct disparities in financial access, recent scholarship suggests that discriminatory practices persist among lenders and in some markets. This was the topic of a landmark study by the Federal Reserve Bank of Boston in 1996,22 which examined whether there were higher mortgage lending denial rates for black and Hispanic borrowers relative to white borrowers. Even after considering a wide range of variables associated with creditworthiness, black borrowers were still 8% less likely to receive loan approval than white borrowers. These findings were controversial, both in their implications and from a methodological standpoint, and sparked subsequent studies, notably research on small business lending by Blanchflower et al. (2003).23 The conclusions of that study indicated that the high rate of minority denials and high credit costs were attributable to lenders considering the personal traits of the potential borrowers, rather than their creditworthiness. This long-standing denial of access to credit has discouraged black business owners from applying for credit.24 Discouragement suppresses the demand for access to credit markets and masks the impact of denials by diminishing the number of black-owned business loan applications. In addition to discouragement and diminishing applications, black-owned businesses face higher rates of denials and pay higher interest rates than white-owned businesses. A study by Asiedu (2012) showed higher denial rates for black and female-owned businesses, with increasing rates of denial over the study period from 1998-2003. It also confirmed the Blanchflower et al. study, finding that banks consistently charged these businesses with higher interest rates.25Cavalluzzo and Wolken (2005)26 studied the role a business owner’s wealth and race played in small business lending decisions. The study identified substantial differences between racial and ethnic groups. While greater personal wealth, specifically homeownership, was associated with a lower probability of denial, even after controlling for wealth, there were differences in denial rates across groups. Cavalluzzo and Wolken concluded, “…information on personal wealth explained some of the differences between Hispanic and Asian-owned business and those owned by whites, but almost none for African American businesses.”27 A study by Bates & Robb (2016)28 found that higher rates of rejection and lower loan amounts typified lending to black and Hispanic-owned minority business enterprises (MBE). This raised the question of whether a business’s location in a minority neighborhood or owner race was a contributing factor in loan decision-making. While MBEs are concentrated in minority neighborhoods, white-owned businesses in minority neighborhoods had significantly higher rates of loan acceptance. The study concluded that greater business-owner wealth, not the location in a minority neighborhood, opened doors to credit opportunity, while owner race closed them. A further study by Fairlie, Robb & Robinson (2016) of capital acquisition by start-up small businesses found that even though differences in creditworthiness were important, after controlling for a diverse set of firm and founder characteristics, there were consistently higher rates of loan denial to black-owned businesses.29 Additionally, in accord with Blanchflower’s 2003 study, much higher levels of owner discouragement were noted among minority business-owners.
The literature shows that higher denial rates for black and Hispanic small business loan applicants are an ongoing issue. However, causality and linkage with discriminatory practices are more difficult to assess. Several problems impact research in this area, most pronounced are inadequacies of the currently available datasets. Specifically, the linkage between applicants’ race/ethnicity and credit scoring is difficult to assess.
The work undertaken in this report expands upon earlier work by NCRC’s research team, which culminated in the publication of “Shaping small business lending policy through matched-pair mystery shopping.”30 This paper notes many inadequacies in the current reporting and regulatory frameworks for small business lending. These inadequacies are especially relevant for minority entrepreneurs, vulnerable groups who have been subject to exploitation and discrimination in the financial products marketplace. The earlier study also implemented a mystery shopping framework to gather information on discrimination against minority small business entrepreneurs who sought financing to expand their businesses.
Current small business lending data: The proverbial black hole
Robust data collection and analysis is vital for any business to succeed. In the lending market, data collection enables better tracking of access to credit, identification of barriers to access and informs efforts to overcome these barriers. Simply put, better data on lending markets will improve access to credit.31 Without robust reporting requirements, stakeholders have no means of holding lenders accountable for meeting the credit needs of the markets they serve. Data is not just an important tool for advocates and regulators. Data enables lenders to identify missed profitable opportunities and correct potential costly fair lending violations.
The 2008 mortgage crisis perfectly illustrated the need for more insight into the financial industry’s lending practices. This need was not just for mortgage lending. Congress recognized a broader need with the passage of Section 1071 of the Dodd-Frank Act.32 Section 1071 amended the Equal Credit Opportunity Act (ECOA)33 to require financial institutions to compile, maintain and report information concerning credit applications made by women-owned and minority-owned small businesses. The purpose of Section 1071 was to “facilitate the enforcement of fair lending laws and enable communities, governmental entities and creditors to identify business and community development needs and opportunities of women-owned, minority-owned and small businesses.”34
These types of reporting requirements were not a new concept. In 1975, Congress implemented the Home Mortgage Disclosure Act (HMDA),35 recognizing that some financial institutions had contributed to the decline of certain neighborhoods by their failure to provide adequate home financing to qualified applicants. The banking industry’s history of residential steering, restrictive covenants and redlining took a huge toll in urban areas.36 HMDA enabled the public to view banks’ lending information to determine whether financial institutions were serving the housing and credit needs of the communities in which they’re located. HMDA required the collection and disclosure of data about applicant and borrower characteristics to assist in identifying possible discriminatory lending patterns and enforcing anti-discrimination statutes. The goal of Section 1071 is to apply the same type of reporting requirements to small business loans.
The Dodd-Frank Act tasked the CFPB with the responsibility of centralizing the collection of small business lending data and making that data public. However, it’s been over eight years since the passage of the act, and Section 1071 still has not been implemented. The CFPB’s only concrete step to move forward with the collection of data required under 1071 was to release a request for information regarding the small business lending market in the summer of 2017. Over ten years later, it remains on the bureau’s “pre-rule” agenda. It is unclear when, if ever, banks will be held responsible for collecting small business data, and when the public will gain insight into this vital aspect of wealth-building in the U.S.
Publically available small business lending data: More questions than answers
In its 2017 white paper on the small business lending landscape, the CFPB estimated that the total aggregate amount of debt financing available to small businesses was approximately $1.4 trillion.37 This included an estimate of all available capital including term loans and lines of credit, supplier financing, equipment leasing, business credit cards, SBA and microloans, factoring and merchant cash advances.
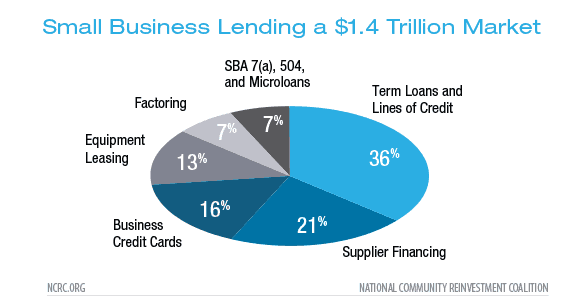
However, without the implementation of any meaningful, concrete data reporting requirements for lending institutions, these are just estimates. The CFPB utilized data released from the SBA in 2013 and admitted that “currently there is only a very limited ability to accurately size the small business lending market even by broad product categories, let alone subcategories.”38
Upon request, the SBA will provide data on its loan programs, including 7(a), 504 and microloans. While the SBA only comprises a small percentage of small business loan volumes, (3% to 7%), it is an important program in enabling minority access to capital, though the equity and efficiency of the program’s recent performance have been questioned.39
Data collected under the CRA offers some additional insight, but CRA data only shows the aggregate dollar volume of loans originated to businesses with revenues less than $1 million, not individual loan amount or type of loan, and is only required from institutions with assets over $1.2 billion.40
Using CRA reported data, the FFIEC provides publicly available data on loans by census tract and income category; however, similar to CRA data, it aggregates the loans by revenue size of the business (above and below $1 million) and loan dollar amount (below $100,000, $100,000–$250,000 and above $250,000).
Earlier this year, the Federal Deposit Insurance Corporation (FDIC) released its own small business lending data based on a nationally representative survey of 1,200 banks.41 It found that currently available data drastically understates the extent of small business lending, especially for small banks. This emphasizes the need for enhanced data collection so that the public can more fully understand the extent of the business lending market.
NCRC research
In an attempt to gain insight into this opaque market, NCRC engaged in a seven-city survey focused on small business lending practices from 2008 to 2016. NCRC examined Atlanta, Houston, Los Angeles, Milwaukee, the five boroughs of New York City, Philadelphia and Washington, D.C. The study group is representative of a range of regional economies, from large, thriving economies like New York City to smaller, lower-performing economies like Milwaukee.
NCRC’s report uses data derived from the limited publicly available sources: CRA related FFIEC small business reporting aggregate and disclosure files and SBA lending data for the 7(a) program.42 Additionally, data from both the Survey of Business Owners and Self-Employed Persons (SBO 2012) and the Annual Survey of Entrepreneurs (ASE 2016) was used to evaluate the levels of entrepreneurship by race/ethnicity.43
Overall investment in small business loans
As noted, the lack of data makes it extremely difficult to make meaningful inferences about the small business lending market, especially considering the large increases in bank deposits in the major markets of New York City, Los Angeles, Houston and Philadelphia during NCRC’s study period. As these increases in deposits in local institutions climbed, the volume and amount of small business loans reported by depository institutions under CRA (i.e., loans under $1 million) stagnated in all but one market (Houston). It is difficult to assess how local banks are investing their increasing deposits, but the CRA reporting suggests that the increased capital is not being invested in small business loans. The mismatches shown below – of increasing deposits but decreased small business lending – have been a national trend. However, without further data, it is impossible to know if banks are doing substantially less lending or if lending activity shifted to much larger loans. The CRA data on lending by depository institutions in these metro areas indicate that, at the very least, the average size of small business loans is decreasing.
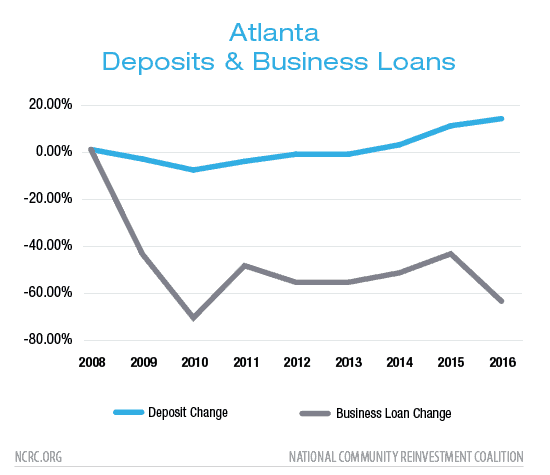
Atlanta: While deposits increased by 15%, small business lending by depository institutions declined over 40% during the period.
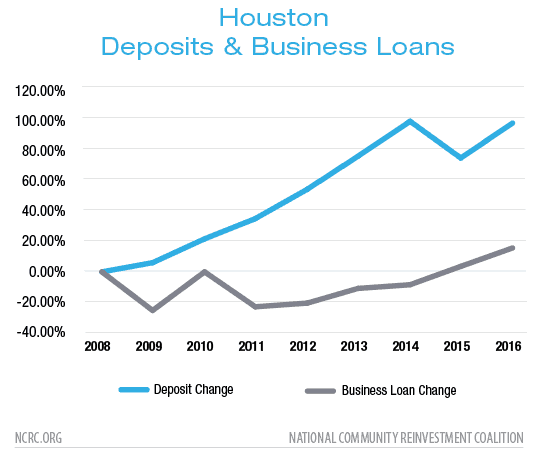
Houston: While deposits increased by 100%, small business lending by depository institutions increased by just 19% during the period.
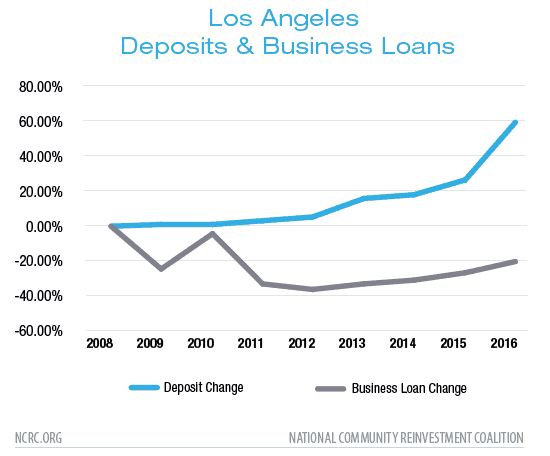
Los Angeles: While deposits increased by 60%, despite Los Angeles’ robust economy, small business lending by depository institutions decreased by 20%.
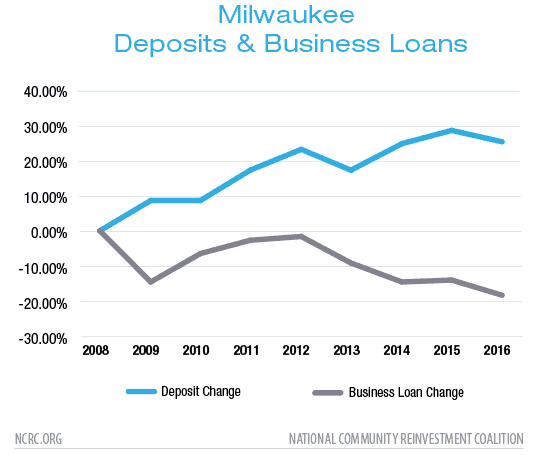
Milwaukee: While deposits increased by 25%, small business lending by depository institutions decreased by nearly 20%.
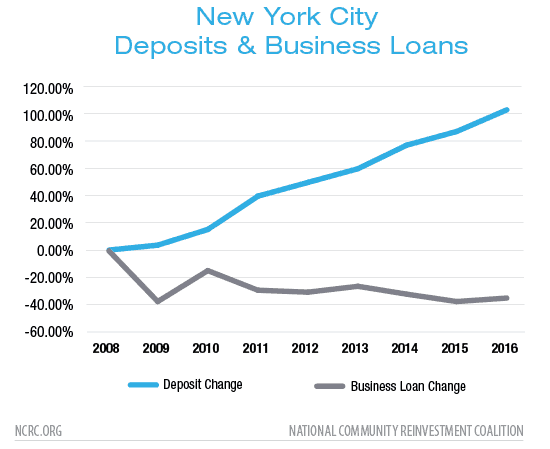
New York: While deposits increased by 100%, small business lending by depository institutions decreased by nearly 40% throughout the five boroughs.
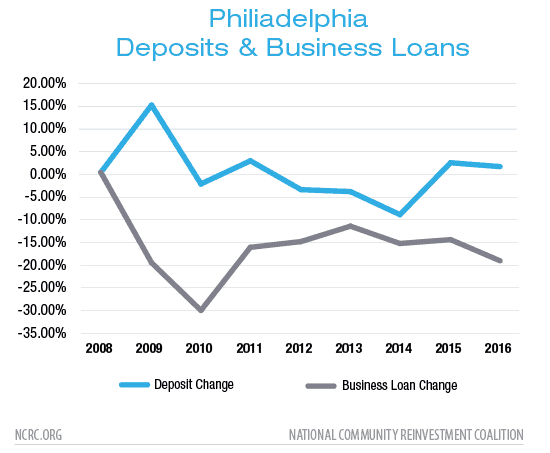
Philadelphia: Deposits did not increase in the Philadelphia market. Small business lending by depository institutions decreased by nearly 20% below 2008 levels.
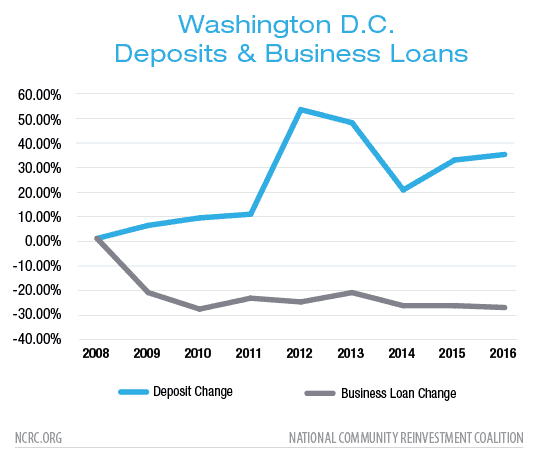
Washington, D.C.: Deposit increases reached over 35% in the Washington, D.C., market. Small business lending by depository institutions decreased by nearly 20% from 2008 levels.
The racial divide
The other major finding of this report is the large divide in black and Hispanic business-ownership relative to their proportion of the population. While the SBO reports that the overall number of firms owned by minorities is robust, a close analysis reveals disparities in the types of businesses owned by black and Hispanic entrepreneurs. For instance, over 2.5 million businesses were black-owned in 2012. However, only 109,000 of these firms had employees, resulting in only 2.1% of firms with employees being black-owned. Black and Hispanic-owned businesses greatly lag Asian and non-Hispanic white-owned businesses in terms of both sales and employment. The Office of Advocacy of the SBA noted the disparity in both the revenue and size of black and Hispanic-owned businesses when contrasted with other groups.44
NCRC’s study areas reflect this same racial gap in business ownership. Non-Hispanic white and Asian small business ownership is robust in all metro areas studied. In every case, black and Hispanic small business owners fall far below their representation as a share of the population in the area.
Minority ownership of firms with employees
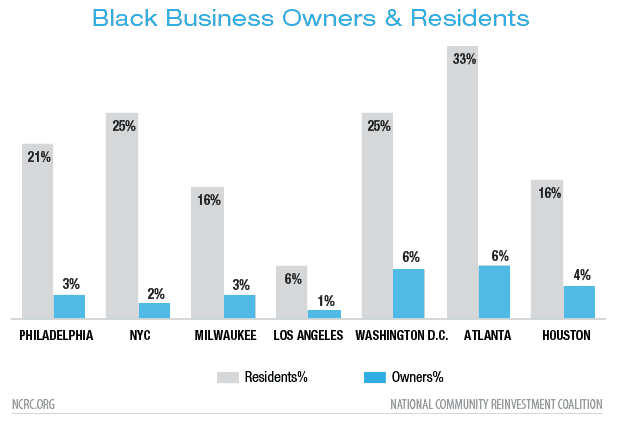
Firms with employees are critical for communities since they expand job opportunity beyond the business owner. While any small business is an important component to local economies, businesses without employees are often a “wage-replacement” strategy for underemployed individuals, which supply benefits that are inferior to those of employer-provided jobs.45 As a consequence, the data in this analysis compares the residential percentage of population with minority business ownership of firms with employees.
Black small business ownership of firms with employees lags far behind their percentage of the residential population. Even in Atlanta, New York, and Washington, D.C., cities with the highest levels of black entrepreneurship, there are low levels of ownership relative to the percentages of black residents.46
Hispanic small business ownership of firms with employees is higher than black ownership relative to population size in most markets. However, Hispanics still lag far behind Asian and white business ownership levels.47
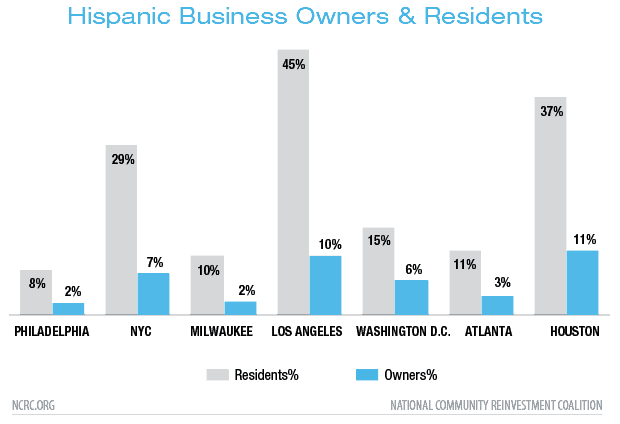
In all of the study areas, white entrepreneurship exceeds that of minorities relative to their percentages of the population.
Small Business Administration 7(a) loans
NCRC’s examination of SBA lending data shows similar gaps in black and Hispanic participation in the business lending marketplace reflected in the low lending volumes for those groups under the SBA 7(a) guaranteed loan program.
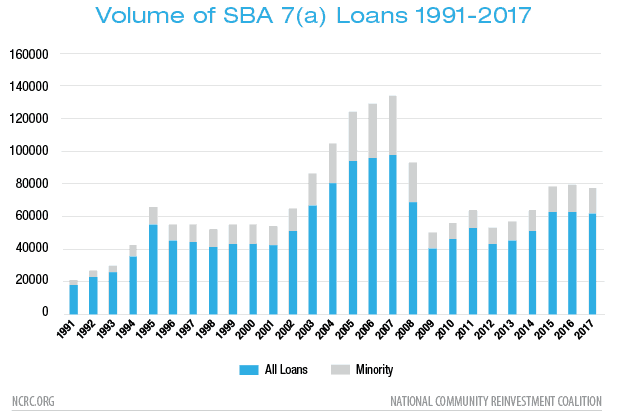
The SBA was established by Congress in 1953 to increase the availability of credit to small businesses. The SBA lending program is designed to reduce the risk of lending for banks, thereby increasing the access to capital for qualifying small businesses. Overall, lending patterns since 1991 show considerable growth from 2001 to 2007, followed by a precipitous decline over the following two years ofthe Great Recession.
The SBA data shows that, while the percentage of loans to black small businesses increased from 2006 to 2008, these loans declined from about 8% to 3% during the Great Recession and have yet to recover. Lending to Hispanic business owners has been flat, around 5% through 2017. Loans to Asian owners declined from over 20% of SBA 7(a) loans in 2007 to 15% in 2009, but have recovered since 2013 to comprise over 20% of the total number of loans.
The SBA does not provide individual demographic or economic data for borrowers in its programs. Since SBA lending is such a small portion of business lending, it is difficult to assess the entire market with just a few inferences.
Loan volumes and the impact of income
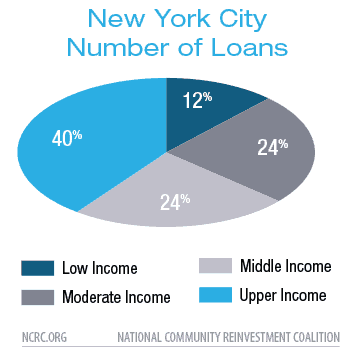
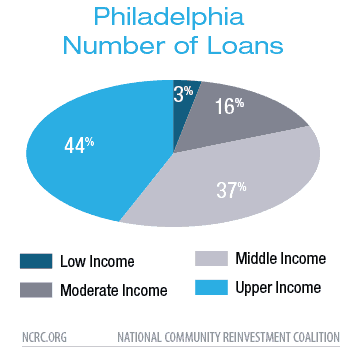
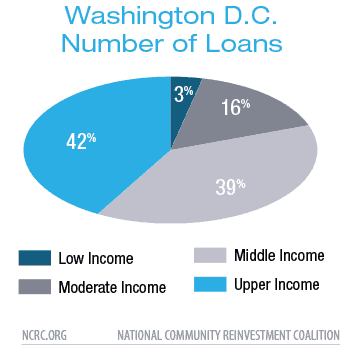
CRA lending data from 2014 to 2016 indicates that upper-income areas receive a disproportionately large share of loans.48 In every study area, more than 40% of CRA loans go to areas in which borrowers’ incomes exceed 120% of the median family income. In every market except New York City, moderate-income areas receive less than 20% of CRA loans and low-income areas, those with incomes below 40% of the median family income for the MSA, receive less than 10% of CRA loans. In New York City, 24% of loans go to borrowers in moderate-income areas and 12% of loans go to borrowers in low-income areas.
Homeownership
NCRC’s report also shows that the low levels of black and Hispanic business ownership and home ownership are interlinked components of the racial wealth divide. Business start-ups often utilize home equity as collateral for lending.49 Low levels of black and Hispanic homeownership may be an additional impediment for those groups in securing access to credit for small business formation. The combination of reduced small business lending, anemic growth in some regional markets and low rates of homeownership are some of the factors responsible for low rates of black and Hispanic business ownership and are key components in a structural racial wealth divide in the United States.
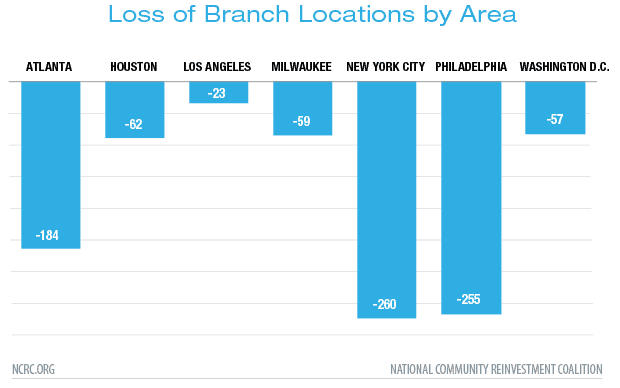
Branch closures
Due to the Great Recession and the rise in online banking services, there was a broad-scale contraction in the number of bank branch locations from 2009 to 2017, with 9,666 of the nation’s 95,379 branches closing.50 During our research time frame (2008-2016), we found substantial declines in branch locations in the seven metro markets. Because their market sizes are much smaller than the New York metro area, Philadelphia and Atlanta were particularly hard hit. Los Angeles had the lowest rate of branch location closures. The closure of bank branches is particularly damaging for small businesses, which often rely on access to a nearby local branch to make their deposits and exchange cash. Additionally, strong relationships between small businesses and banks still dominate lending decisions.51 A diminishing number of bank branches can adversely affect the availability of sources for small business lending in a market and lead to a persistent decline in local small business lending. Studies show that annual originations can fall by over 9% after a branch closure and remain depressed for up to six years.52 This amounts to a cumulative loss of $2.7 million forgone small business loans for the closing of each branch. This decline often persists even after the entry of new banks.53 The effects are very localized, dissipating within six miles, and are concentrated in low-income and high-minority neighborhoods.54
Conclusion of seven-city survey
Several factors contributed to the gap in small business ownership for black and Hispanic entrepreneurs. A history of redlining and segregation established separate and unequal economic opportunities for minorities. This hampered wealth-building opportunities like establishing equity through homeownership. Residential segregation dampens home value appreciation in minority neighborhoods. The home mortgage foreclosure crisis and subsequent Great Recession further damaged housing markets and businesses in minority neighborhoods. Despite this, banks have seen the number of deposits they hold soar, while their lending to small businesses sagged. Where are these deposits being invested? Certainly not in neighborhood small businesses, but a clear answer is difficult to find since the current reporting on business lending is so incomplete.
The limited data that banks are required to report on their small business lending paint a bleak picture, with low levels of participation in entrepreneurship and lack of access to capital through the traditional banking market, especially for black and Hispanic business owners. In all seven cities, non-Hispanic white and Asian small business ownership is robust, while black and Hispanic small business ownership lag in comparison to their share of the population of the area. The racial business-ownership divide is particularly pronounced when examining businesses with employees. This indicates that the benefits of small business growth in providing employment opportunities in minority communities are not being realized. Banks play a key role in providing capital to increase entrepreneurship and opportunity. However, what is the customer service experience of minorities like when they approach banks for loans? Are there differences in treatment compared to their Non-Hispanic white counterparts?
Mystery shopping: A case study of Los Angeles’ small business application interactions
NCRC’s look into the small business lending market in these seven large cities revealed the gap in capital accessibility. While analysis of the overall small business marketplace provides some insight into lending activities, these measures do not account for the experience of a small business owner when attempting to obtain a loan.
Assessment of branch-level treatment of potential borrowers, particularly minority entrepreneurs, is vital to understanding the current state of the small business lending marketplace. One way to do this is through controlled testing of customer service interactions utilizing mystery shopping methods. Mystery shopping, or testing, is a commonly used tool for advocates and lending institutions foruncovering problems in banks’ business practices and policies. Testing samples customer service interactions by sending mystery shoppers (testers) of different races and/or genders into lending institutions posing as well-qualified borrowers with similar credit profiles. The testers inquire about loan products and then evaluate differences in treatment during their customer service experience. The quality of experience with bank customer service representatives matters, particularly if poor service creates impediments for members of communities that have historically been denied equal access to credit.
NCRC is investigating the potential for differences in the treatment of small business customers during the pre-application (or loan inquiry) stage of the loan application in several cities. NCRC’s testing focused on micro businesses, those with fewer than three employees, and smaller dollar loans, under $100,000, which are more likely to support smaller businesses and provide wealth-building opportunities. Thus far, NCRC has tested over 160 bank branch locations in four MSAs for differences in the treatment of testers of different genders and races. At the pre-application stage, the purpose of testing is not to examine disparities in loan denial rates, but to look at differences reflected in product discussion and explanation; suitability questioning; and explanations and disclosures concerning annual percentage rates, fees and the documentation required to receive the loan. NCRC’s results further demonstrate the critical need for reliable, primary data to inform regulatory agencies as they work to implement available protections to ensure equal access to credit within the small business lending marketplace.
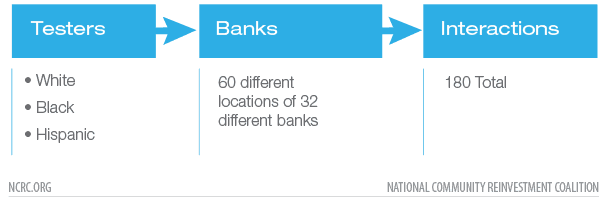
The case study in this report analyzes the results from testing in the Los Angeles MSA. NCRC selected 32 bank branch locations located in census tracts with less than 25% minority residents. The banks selected represented a broad spectrum in their small business lending patterns to borrowers located in low-to-moderate and middle-to-upper income areas. The tests utilized male testers who were white, black and white Hispanic to assess customer service interactions with bank small business lending specialists (Figure #). A total of 180 interactions (tests) were compared for differences between testers. The purpose of the research was to determine the baseline customer service level that minority and non-minority testers received when seeking information about small business loans.
The study is designed to answer the following research questions: “Are minority and non-minority small business owners with similar economic and business profiles:
Presented with the same information?
Required to provide the same information?
Given the same level of service quality and encouragement?”
Testing methodology
Testers were trained extensively on business and banking terminology and loan products. A profile containing the information testers were to present to the financial institutions during the test were provided. Testers went to the banks with nearly identical business profiles and strong credit histories to inquire about a small business loan product to expand their business. The profiles of all testers were sufficiently strong that on paper, either profile would qualify for a loan. Furthermore, the black and Hispanic testers’ profiles were slightly better than their white counterparts in terms of income, assets and credit scores. For each test, three matched testers, one black, one Hispanic and one white visited the same retail bank branch location.
Immediately following the interaction, testers were asked to answer either yes or no about whether specific behaviors, queries and comments were made by bank small business lending specialists. These interactions were categorized in four stages: the initial introduction, information gathering by the bank, information provided to the customer and the close of the discussion. For example, did the bank personnel smile, introduce themselves and offer a seat to the tester during the introduction? Did the bank personnel query the tester regarding credit score, education level and homeownership as part of their information gathering? Did the bank personnel provide information on interest rates, fees and length of wait for approval? Finally, at the close of the interaction, did the bank personnel offer the tester an application or business card, or thank them for coming in?
NCRC and its academic partners55 applied statistical analysis in evaluating whether differences in the interactions between white testers and testers of color were significant. The chi-square test for independence is a particularly robust way for social scientists to evaluate whether or not there are significant differences in outcomes between groups. The simple “yes or no” categorization of the interactions between bank personnel and testers and the number of interactions observed enabled the results of the tests to achieve a high level of validity.
Testing results
In almost every measure evaluated, white testers received superior customer service by being asked fewer questions about eligibility and receiving more information about the loan product than were their black and Hispanic counterparts. While not all the differences measured were statistically significant, the results outlined below illustrate a troubling picture of the type of service entrepreneurs face when attempting to access additional capital, particularly the difficulties faced by black and Hispanic borrowers. Standard customer service measures and presentation of correct loan information was lacking for all testers, regardless of race or ethnicity, though some tests did show significantly worse treatment in the case of the black or Hispanic testers. In addition to differences in treatment categorized below, bank representatives’ knowledge of business loan products and terms varied widely, across different banks and even within the same branch. This lack of knowledge made it difficult for the potential borrowers to know what options were available, what were the costs associated with different options and what documentation would be required to apply for the loans.
Greeting
A potential customer entering a bank should expect a basic greeting that includes an introduction, being asked for their name and offered a seat. These are standard customer service practices that make a customer feel valued and encouraged.
During the introductory phase of the interaction, bank personnel introduced themselves to white testers 78.33% of the time, but only 60.00% of the time to black testers, a statistically significant difference (p <.10) (Figure #). Other differences in interactions at the introductory level were not statistically significant in this set of tests, but still illustrate a deficit in the level of service small business borrowers can expect when entering a banking institution. Virtually all of the factors outlined below should be expected to be implemented the majority of the time, especially when working with well-qualified borrowers. Bank personnel offered a seat to less than half of the Hispanic and black testers. Just over half of the bank representatives stood to greet the testers, regardless of their race.
Personal information requested from tester
All testers’ business profiles in terms of revenue, profits and time in business were sufficient to be qualified for the loan amount they inquired about without the need for personal collateral or personal financial statements. Nevertheless, in many cases, the bank representative still inquired about testers’ homeownership and household (spouse) income and informed testers they would need to provide documentation of their personal financials in addition to their business financials.
In terms of statistical significance, the minority testers were requested to provide more information than their white counterparts in six areas. Black testers were the only group asked about their education level, with 3 of the 60 testers asked (p <.05). Hispanic testers were asked significantly more often than white and black testers about the amount of their credit card debt (5 versus 1 time, p <.10). The Hispanic testers were also asked for their credit report significantly more often than white testers (20 versus 4 times, p <.001). Black testers were also asked for their credit report significantly more often than white testers (11 versus 4 times, p <.001). Black and Hispanic testers were told more often of the need for personal income tax statements (44 times versus 4 times, p<.005), personal financial statements (39 times versus 9 times p<.005) and personal W2 forms (17 times versus 0 times p<.005)) significantly more often than their white counterparts.
While there could be legitimate business reasons for certain loans to require personal credit and financial information, the information requested from all potential well-qualified borrowers should be consistent. Bank representatives should not disproportionately tell Hispanic and black borrowers about the need for a credit report, inquire about credit card debt or request personal financial documents. There should be no reason to ask about a borrower’s education level when applying for a loan for an established business. These actions can discourage borrowers from continuing the loan process and result in a fair lending violation for the banking institution.
Loan information provided by bank representative
When discussing loan options with a qualified borrower, bank personnel should always disclose certain loan factors, so the borrower can be confident they are making an educated choice about loan type and lending institution. A borrower should expect a loan officer to explain about approval times, fees, interest rates and monthly payments. Knowledge and consistency in explaining loan options is an essential customer service tool. Even if a loan officer is not familiar with a particular product, he should always have the ability and willingness to find out the information requested and follow-up with a potential borrower. A potential borrower is unable to make responsible borrowing decisions without being presented with all of the information.
During this case study, white testers were provided with significantly better information about the loan products in three areas: the interest rate, loan fees and the length of time for approval. White testers were provided with the interest rate 83% of the time, while Hispanic testers received the information less than half the time, 44% (p <.05). Information on loan fees was provided 64% of the time to white testers, and only 29% of the time to black and 20% of the time to Hispanic testers (p <.05). For the approval time, white testers were given this information 58% of the time, while black testers received it 24% and Hispanic testers only 14% of the time (p <.01). White testers were also more often told about monthly payment amounts, but this was not a statistically significant difference compared to black and Hispanic borrowers.
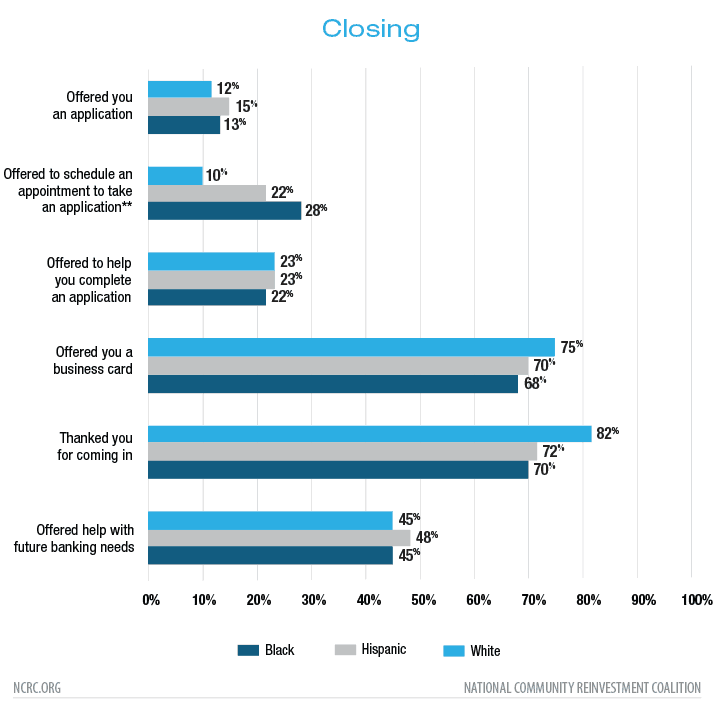
Closing
Similar to the greeting, the way loan specialists end appointments is vital to the overall customer experience. Being thanked for coming in, offered help with future needs and assistance in filling out an application keeps the borrowers from feeling discouraged from the banking process. All testers in this study were well-qualified borrowers for the amounts of loans requested. All testers had exceptional business profiles, incomes and credit scores. There should not be any reason that every single tester was not offered an application, offered help completing an application or offered an appointment to come in and fill out an application.
During this case study, white testers were more often offered a business card and thanked for coming in. Less than one-third of testers in any category was offered an application or offered help in completing an application.
There was a significant difference in whether the small business representative offered to set up an appointment to take the application. White testers were offered this 10% of the time, compared to Hispanic testers at 22% and black testers at 28% of the time (p <.05). This is possibly an indicator of superior service and a desire to encourage minority applications, or it is perhaps creating an additional hurdle to the loan process, or even patronizing, depending on the context of the interaction. Regardless of the motivations of the loan officer, this standard business practice should be offered consistently across all borrowers, and certainly in more than 10% to 28% of cases. How bank personnel acted in closing these visits with well-qualified borrowers shows the stark reality of what small business owners face attempting to move forward with a loan.
Conclusion of testing case study
NCRC’s testing of small business lending practices shows a pattern of poor customer service regardless of race or nationality. However, there is a disproportionate pattern of worse service for black and Hispanic testers, which could result in discouraging minority entrepreneurs from seeking access to capital. Although every tester presented an excellent credit profile as a well-qualified borrower for the type of loan they were seeking, testers were often provided with inconsistent information about loan terms, what options were available and what documentation was needed. There were additional inconsistencies in the help offered in continuing the loan process. While the introduction portion of the interaction was only statistically significantly different in whether the small business representative introduced themselves, white testers were offered superior service on nearly every measured metric. Minority testers, and especially the Hispanic testers, were asked for more information regarding their economic status and creditworthiness than the white control group. The banking representative made these inquiries after the minority tester had already provided information about their superior financial status.
Additionally, bank representatives offered white testers significantly more information regarding the terms of the loan, fees and approval time – vital information to make an informed, responsible credit choice. There was only one area of service which might be considered superior for the minority testers: the offer to establish an appointment for submission of the application. Even this only happened in 28% of the interactions.
Denial of capital does not just happen at the loan approval stage. The initial customer service interaction is an essential first step in gaining access to capital. Denial of capital can occur because of the way a potential borrower is first greeted, the level of future services offered, the amount of time spent with the borrower and documentation requested of the borrower. When borrowers do not feel encouraged or valued, regardless of their eligibility for a loan, it can result in an effective denial by causing the potential client to decide not to proceed with pursuing this type of credit. This discouragement has historically been a deterrent to traditional lending for black and Hispanic business-owners.56
Systemic impact of findings
While the lack of customer service for small business owners, in general, is concerning, the gap in treatment faced by black and Hispanic testers demonstrates that racial bias in financial access is not a thing of the past. Institutional discrimination and segregation have wide-ranging social impact. Discriminatory lending practices, such as redlining, systematically denied credit access in many minority communities.57 The effects of these practices have continued to negatively impact the ability of these communities to build wealth for generations. Minority and female business owners consistently face both higher rates of denial and higher credit costs when seeking access to credit.58
Differences in treatment faced by minority borrowers are not just bad for the country’s economic growth and morality; it’s also illegal. ECOA prohibits discrimination in any aspect of consumer or commercial credit transactions, including business credit.59 Discrimination includes failing to provide information or services; providing different information or services regarding any aspect of the lending process, including credit availability, application procedures or lending standards; and discouraging or selectively encouraging applicants with respect to inquiries about or applications for credit. Differences in treatment or services can result in a fair lending violation, regardless of the intent of the employee. Additionally, banks have a legal obligation under CRA to meet the banking needs of the communities they serve, including small business borrowers.
NCRC is not the only organization to uncover these troubling findings in the lending marketplace. A 2018 study by the University of California found that African American and Latino borrowers face lending discrimination at nearly every turn. Minority borrowers are often charged 5.6 to 8.6 basis points higher interest on mortgage refinance loans, resulting in annual disparities of $250 million to $500 million.60 Reveal’s investigative reporting exposed the prevalence of modern-day redlining in 61 major U.S. cities, fifty years after the Fair Housing Act outlawed it.61 However, both of these organizations had access to rich data sources available to them through HMDA reporting requirements, substantially aiding them in uncovering these widespread issues. If this is the current landscape of the mortgage lending market, can there be much doubt that similar disparities occur in the small business lending market? The difference is that there is no robust data set which would allow a more in-depth analysis of small business lending. Without this robust data, lenders can brush off existing research as “anecdotal” and dodge their accountability by criticizing research techniques. Without access to a consistent, standardized and publicly available dataset, it is virtually impossible to determine the extent to which well-qualified business owners, particularly those of color, are routinely shut out of the small business lending market.
The path forward
Despite having only a limited amount of public data, NCRC’s analysis shows a pattern of disinvestment in small businesses and a wide divide in black and Hispanic business ownership relative to the population of these groups. Furthermore, NCRC’s testing indicates that problems in access to information exist at the loan inquiry stage and that black and Hispanic prospective borrowers significantly and disproportionately encounter these issues. This lack of information can result in an effective denial of credit by discouraging the borrower before they even apply.
Congress recognized the need to make financial institutions accountable to the public for their mortgage lending practices over four decades ago. Following the 2008 financial crisis, there was broad recognition that this same level of accountability must apply to the small business lending market. It is the CFPB’s statutory responsibility to promote fair, accessible and transparent credit markets that provide the capital availability that is critical to small businesses and entrepreneurs. The Bureau cannot fulfill its mission, nor can meaningful research and advocacy occur, until the public has access to the data required by Section 1071, and lending institutions are obligated to pay attention to their compliance requirements under ECOA.
In addition to greater data availability, it is vital that CRA examinations include consideration of the type of business loans offered, instead of aggregating term loans, credit cards and lines of credit into a single category. Examiners must be rigorous in their evaluations of lending and services tests.
It is also the responsibility of lending institutions to engage in a concerted effort to improve the experience of well-qualified borrowers, both to meet their CRA obligations and to ensure they are not missing out on profitable financial opportunities. Banks must develop a comprehensive approach to addressing fair lending issues and building customer service standards in their small business lending procedures. Doing so will greatly improve legal compliance and growing efforts to become socially responsible lending institutions.
Stakeholders should also engage in advocacy around improving technical assistance for entrepreneurs looking to raise capital, particularly women and minority business owners. Funding for Women Business Centers (WBCs) and Community Development Financial Institutions (CDFIs) should be increased nationwide, particularly in areas where capital could be particularly hard to access.
Not only is entrepreneurship one of the most common pathways to building wealth, but small businesses are also an integral component of America’s economy. They play a vital role in driving economic activity and job creation. Access to credit is essential for every business to succeed, but regulators, advocates and entrepreneurs continue to have little-to-no insight into how lending intuitions are handling the credit needs of the market. Without robust reporting requirements and concerted effort from the banking industry, small businesses will continue to struggle and the wealth divide will continue to grow.

- https://www.sba.gov/sites/default/files/advocacy/SB-FAQ-2017-WEB.pdf
- https://www.sba.gov/sites/default/files/Finance-FAQ-2016_WEB.pdf
- Consumer Financial Protection Bureau, Key Dimensions of the Small Business Lending Landscape at 19 (May 2017), https://bit.ly/2Uu7D23
- Edward N. Wolff, Has Middle Class Wealth Recovered?, at 28 (Nov. 2017) https://www.aeaweb.org/conference/2018/preliminary/paper/5ZFEEf69 accessed May 6, 2019.
- Woodstock Institute, Patterns of Disparity: Small Business Lending in the Buffalo and New Brunswick Regions, at 1 (April 2017), https://bit.ly/2vlzozP.
- Archana Pradhan & Josh Silver, National Community Reinvestment Coalition Analysis: Small Business Lending Deserts and Oases, National Community Reinvestment Coalition at 11 (September 2014), https://bit.ly/2Uw4uhX.
- A small business is defined as an independent business with fewer than 500 employees (U.S. Small Business Administration 2017).
- U.S. Small Business Administration (2016), Frequently Asked Questions, accessed April 19, 2019, https://bit.ly/2I9WGBV.
- Archana Pradhan & Josh Silver, National Community Reinvestment Coalition Analysis: Small Business Lending Deserts and Oases, National Community Reinvestment Coalition at 13 (September 2014), https://bit.ly/2Uw4uhX.
- Woodstock Institute, Patterns of Disparity: Small Business Lending in the Buffalo and New Brunswick Regions, at i (April 2017), https://bit.ly/2vlzozP.
- Federal Reserve Banks, Small Credit Business Credit Survey: Report on Employer Firms at 7 (2019), https://bit.ly/2IJuuEq.
- Laurie Goodman, et al. Small Business and community development lending are key to CRA compliance for most banks, Urban Wire: Economic Growth and Productivity (Feb. 2019), https://urbn.is/2vlAkUR.
- Rohit Arora, Four Reasons Why Small Business Lending is Hot, Forbes (May 2018), https://bit.ly/2GAQ3EL.
- United States Census Bureau, Survey of Business Owners (SBO) Survey Results: 2012 https://www.census.gov/library/publications/2012/econ/2012-sbo.html accessed April 19, 2019.
- McManus, M., Minority Business Ownership: Data from the 2012 Survey of Business Owners, U.S. Small Business Administration Issue Brief (Sept. 14, 2016) https://bit.ly/2cXNsWa.
- Lisa Dettling et al., Recent Trends in Wealth-Holding by Race and Ethnicity: Evidence from the Survey of Consumer Finances, Board of Governors of the Federal Reserve System, FEDS Notes (Sept. 27, 2017) https://bit.ly/2wmxwp9.
- Pub. L. No. 111-203 § 929-Z, 124 Stat. 1376, 1871 (codified 15 U.S.C. § 78o).
- Federal Reserve Banks, Small Credit Business Credit Survey: Report on Employer Firms at 7 (2016), https://nyfed.org/2oan3s7.
- Ann M. Wiersch et al. Barkley, Click, Submit: New Insights on Online Lender Applicants from the Small Business Credit Survey, Federal Reserve Bank of Cleveland (Oct 2016), http://bit.ly/2sYZju2.
- Mehrsa Baradaran, The Color of Money: Black Banks and the Racial Wealth Gap (2017); Richard Rothstein, The Color of Law: A Forgotten History of How our Government Segregated America (2017).
- 42 U.S.C. ch. 69 § 5301.
- Alicia H. Munnell et al., Mortgage Lending in Boston: Interpreting HMDA Data, American Economic Review vol. 86 no. 1 (March 1996).
- David G. Blanchflower et al., Discrimination in the Small Business Credit Market, Review of Economics and Statistics, vol. 85 (4) (Aug. 2002).
- Federal Reserve Banks, Small Credit Business Credit Survey: Report on Employer Firms at 7 (2016), https://nyfed.org/2oan3s7.
- Elizabeth Asiedu et al., Access to Credit by Small Businesses: How Relevant Are Race, Ethnicity, and Gender?, American Economic Review: Papers and Proceedings 102(3): 523-637 (2012).
- Ken Cavalluzzo & John Wolken, Small Business Loan Turndowns, Personal Wealth, and Discrimination, Journal of Business, vol. 78, issue 6, 2153-2178 (2005).
- id. at 2171.
- Timothy Bates & Alicia Robb, Impacts of Owner Race and Geographic Context on Access to Small-Business Financing, Economic Development Quarterly 30(2) (Dec. 2015).
- Fairlie, Robert, Alicia Robb, and David T. Robinson. “Black and white: Access to capital among minority-owned startups.” Stanford Institute for Economic Policy Research discussion paper (2016): 17-03.
- Sterling A. Bone et al., Policy Watch: Shaping Small Business Lending Policy Through Matched-Pair Mystery Shopping, Journal of Public Policy & Marketing 1-9 (2019) https://bit.ly/2QAmNT7.
- Archana Pradhan & Josh Silver, National Community Reinvestment Coalition Analysis: Small Business Lending Deserts and Oases, National Community Reinvestment Coalition at 11 (September 2014), https://bit.ly/2Uw4uhX.
- Pub. L. No. 111-203 § 929-Z, 124 Stat. 1376, 1871 (codified 15 U.S.C. § 78o).
- 15 U.S.C § 1691 et seq.
- 15 U.S.C. § 1691c-2(a).
- 12 U.S.C. ch. 29 §§ 2801-2811, amended by 12 U.S.C. ch. 3 § 461 et seq.
- Richard Rothstein, The Color of Law: A Forgotten History of how our Government Segregated America (2018).
- Consumer Financial Protection Bureau, Key Dimensions of the Small Business Lending Landscape at 19 (May 2017), https://bit.ly/2Uu7D23.
- Consumer Financial Protection Bureau, Key Dimensions of the Small Business Lending Landscape at 20 (May 2017), https://bit.ly/2Uu7D23.
- Derke Hyra & Meghan Doughty, SBA Lending Equity and Efficiency Challenges, Metropolitan Policy Center School of Public Affairs (Dec. 2014), https://bit.ly/2ILhRJ1.
- Consumer Financial Protection Bureau, Key Dimensions of the Small Business Lending Landscape at 33 (May 2017), https://bit.ly/2Uu7D23.
- Federal Deposit Insurance Corporation, 2018 Small Business Lending Survey https://www.fdic.gov/bank/historical/sbls/ accessed April 19, 2019.
- FFIEC, Community Reinvestment Act Aggregate & Disclosure Files https://www.ffiec.gov/cra/craflatfiles.htm.
- United States Census Bureau, Annual Survey of Entrepreneurs (ASE) Tables (2016) https://www.census.gov/programs-surveys/ase/data/tables.html.
- Office of Advocacy U.S. Small Business Administration, Small Business Lending in the United States (Sept. 2018), https://www.sba.gov/sites/default/files/Small-Business-Lending-in-US-2016-Report.pdf.
- Scott Shane, Why encouraging more people to become entrepreneurs is bad public policy, Small Business Economics 33:141-149 (2009).
- SBO 2012 and 2010 Decennial Census
- Source SBO 2012 and 2010 Decennial Census.
- FFIEC CRA small business loans to businesses with revenue under $1 million 2014-2016.
- Atif Mian & Amir Sufi, House Prices, Home Equity-based Borrowing, and the US Household Leverage Crisis, American Economic Review Vol. 101, No. 5 (Aug. 2011).
- http://maps.ncrc.org/bankdeserts/index.html
- Allen N. Burger et al., Small Business Credit Availability and Relationship Lending: The Importance of Bank Organizational Structure, Finance and Economics Discussion Series 2001-36, Board of Governors of the Federal Reserve System (US) https://bit.ly/2XzHDnD.
- Hoai-Luu Q. Nguyen, Are Credit Markets Still Local? Evidence from Bank Branch Closings, American Economic Journal: Applied Economics 2019, 11(1): 1-32 http://faculty.haas.berkeley.edu/hqn/nguyen_aej_201901.pdf
- Kenneth P. Brevoot et al., Distance Still Matters: The Information Revolution in Small Business Lending and the Persistent Role of Location 1993-2003, Finance and Economics Discussion Series, Division of Research & Statistics and Monetary Affairs, Federal Reserve Board Washington, D.C. (Dec. 2009) https://www.federalreserve.gov/Pubs/FEDS/2010/201008/201008pap.pdf.
- Hoai-Luu Q. Nguyen, Are Credit Markets Still Local? Evidence from Bank Branch Closings, American Economic Journal: Applied Economics 2019, 11(1): 1-32 http://faculty.haas.berkeley.edu/hqn/nguyen_aej_201901.pdf
- Sterling Bone – Utah State Univ.; Glenn Christensen- Brigham Young Univ.; Jerome Williams - Rutgers Univ.
- See supra Literature Review: Racial Bias in Financial Market
- Mehrsa Baradaran, The Color of Money: Black Banks and the Racial Wealth Gap (2017); Richard Rothstein, The Color of Law: A Forgotten History of How our Government Segregated America (2017).
- See generally David G. Blanchflower et al., Discrimination in the Small Business Credit Market, Review of Economics and Statistics, vol. 85 (4) (Aug. 2002); Ken Cavalluzzo & John Wolken, Small Business Loan Turndowns, Personal Wealth, and Discrimination, Journal of Business, vol. 78, issue 6, 2153-2178 (2005); Elizabeth Asiedu et al., Access to Credit by Small Businesses: How Relevant Are Race, Ethnicity, and Gender?, American Economic Review: Papers and Proceedings 102(3): 523-637 (2012).
- 15 U.S.C. § 1691 et seq.
- Robert Bartlett et al., Consumer-Lending Discrimination in the Era of FinTech, UC Berkley Public Law Research Paper available at https://papers.ssrn.com/sol3/papers.cfm?abstract_id=3063448.
- Aaron Glantz & Emmanuel Martinez, For people of color, banks are shutting the door to homeownership, Reveal News (Feb. 15, 2018) https://bit.ly/2W0OJRK.