
When I was 16 years old, I had a job washing dishes. After six months, I got a fifty-cent raise, about 10% for a minimum wage job back then. I was told it was a “reward” for doing well, but I didn’t feel like I was making any more money.
This story still applies to millions of hardworking Americans today. While many economic indicators are better than they have been in years, leading to recently published reports asserting that income inequality is not as bad as we have been told, many people are working multiple jobs just to get by.
Relax, the reports say, even the families at the bottom of the income ladder are doing better today than they were in 1979, the year used as a comparison by the Washington Post. And once you figure in all of the riches imparted by food stamps and Section 8 housing, working-class families are actually sitting quite nicely.
But we know that they aren’t. For the National Community Reinvestment Coalition members and program teams that work with low- and moderate-income (LMI) families every day, this isn’t academic theory or clever manipulation of numbers. A narrative that casts doubt on the severity and long-term increase in economic inequality is a threat to efforts promoting investment in LMI families and neighborhoods.
There are two main points to understand about the debate on income inequality.
1. Income is hard to measure. Below is a chart of historical incomes reported by the U.S. Census that is a useful guide to what people have historically earned in 2017 dollars. This figure includes wages, investments, public assistance and pensions. Depending on the source of data, how inflation is calculated and if we look at pre- or post-tax income, these figures move around a bit.
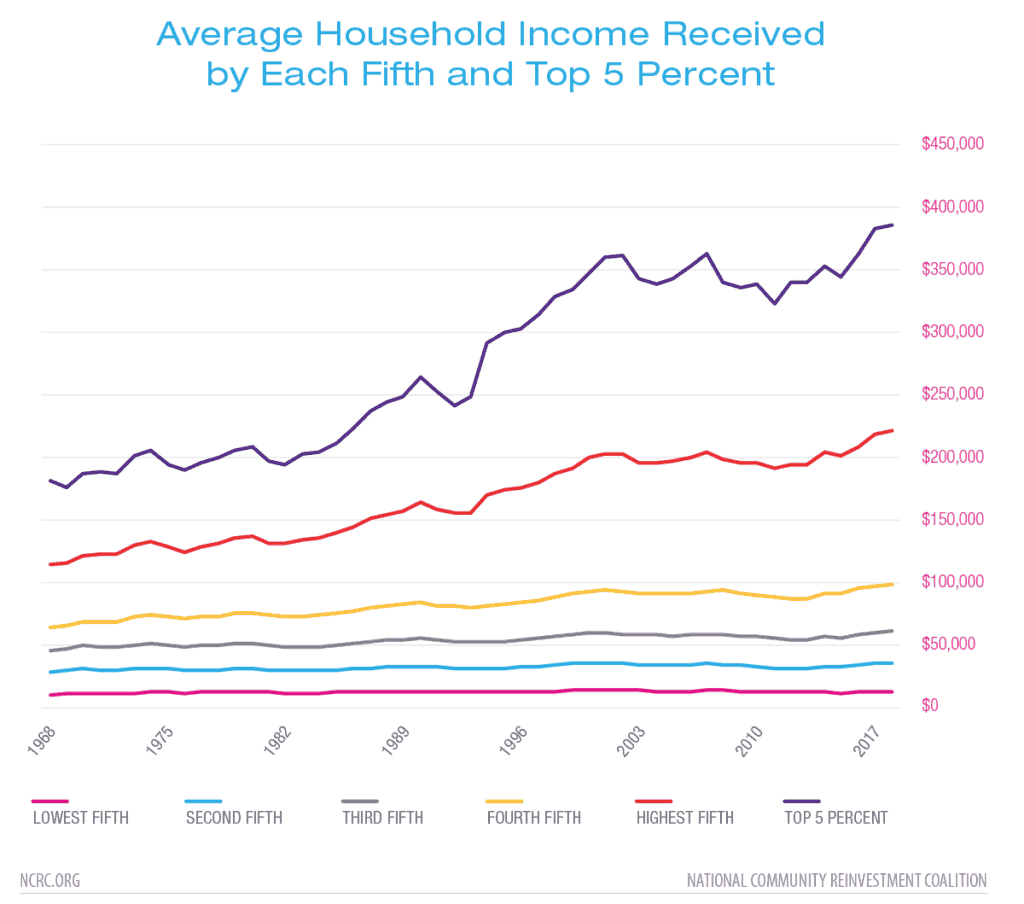
According to the Washington Post, average inflation-adjusted household incomes for the middle fifth of Americans (by income) rose from $56,400 in 2000 to $64,700 in 2015. That’s a 15% gain.
What they leave out is that the group just above the middle-income group made about $100,000. The average income of the top group was $220,000. Quibbling over inflation indices and taxes won’t close that massive gap.
2. Income doesn’t really matter by itself. It’s the inequality between the richest and the poorest that determines the lived experience you go through every day. This is because the cost of what we buy, from housing to medical care to food, is largely determined by what people are willing to pay for it. How we calculate your income doesn’t matter a lot when some families earn twice as much as you do and by default set the prices.
The slight difference between absolutely or virtually stagnant incomes isn’t going to make a low-income family that struggles each month to pay the bills any wealthier. For the NCRC community, the assertion that income inequality isn’t as bad as we thought is a dangerous threat to the reinvestment efforts we work for every day.
Photo by John Legrand on Unsplash
Jason Richardson is director of Research and Evaluation at NCRC.
