Shifting Neighborhoods
Gentrification and cultural displacement in American cities
[mashshare]
Jason Richardson, Director, Research & Evaluation, NCRC
Bruce Mitchell, Ph.D., Senior Research Analyst, NCRC
Juan Franco, Senior GIS Specialist, NCRC
March 19, 2019
EXECUTIVE SUMMARY
Gentrification is a powerful force for economic change in our cities, but it is often accompanied by extreme and unnecessary cultural displacement.[1] While gentrification increases the value of properties in areas that suffered from prolonged disinvestment, it also results in rising rents, home and property values. As these rising costs reduce the supply of affordable housing, existing residents, who are often black or Hispanic, are displaced. This prevents them from benefiting from the economic growth and greater availability of services that come with increased investment. Gentrification presents a challenge to communities[2] that are trying to achieve economic revitalization without the disruption that comes with displacement.
This study found that from 2000 through 2013 the following occurred:
- Gentrification and displacement of long-time residents was most intense in the nation’s biggest cities, and rare in most other places.
- Gentrification was concentrated in larger cities with vibrant economies, but also appeared in smaller cities where it often impacted areas with the most amenities near central business districts.
- Displacement of black and Hispanic residents accompanied gentrification in many places and impacted at least 135,000 people in our study period. In Washington, D.C., 20,000 black residents were displaced, and in Portland, Oregon, 13 percent of the black community was displaced over the decade.
- Seven cities accounted for nearly half of the gentrification nationally: New York City, Los Angeles, Washington, D.C., Philadelphia, Baltimore, San Diego and Chicago.
- Washington, D.C., was the most gentrified city by percentage of eligible neighborhoods that experienced gentrification; New York City was the most gentrified by sheer volume. Neighborhoods were considered to be eligible to gentrify if in 2000 they were in the lower 40 percent of home values and family incomes in that metropolitan area.
- The study lends weight to what critics say is a concentration not only of wealth, but of wealth-building investment, in just a handful of the nation’s biggest metropolises, while other regions of the country languish.
- The strict tests for gentrification and displacement in this study and the limitations of the data available likely undercounted instances of gentrification and displacement.
- Most low- to moderate-income neighborhoods did not gentrify or revitalize during the period of our study. They remained impoverished, untouched by investments and building booms that occurred in major cities, and vulnerable to future gentrification and displacement.
[optin-monster-shortcode id=”pp9hbd0oskt3h64b5asb”]
A major transformation is occurring in the most prosperous American cities. Many of the 600+ member organizations of the National Community Reinvestment Coalition (NCRC) have raised concerns about gentrification, displacement and transformations in their communities. We wanted to better understand where gentrification and displacement was occurring, and how to measure and monitor it. Does gentrification also mean displacement?
Using U.S. Census Bureau and economic data, NCRC found that many major American cities showed signs of gentrification and some racialized displacement between 2000 and 2013. Gentrification was centered on vibrant downtown business districts, and in about a quarter of the cases it was accompanied by racialized displacement. Displacement disproportionately impacted black and Hispanic residents who were pushed away before they could benefit from increased property values and opportunities in revitalized neighborhoods. This intensified the affordability crisis in the core of our largest cities.
Gentrification was most intense in the nation’s biggest coastal cities, yet in medium to small cities of the nation’s interior it was rare: Most of the nation’s cities and towns did not experience gentrification as measured in this study.
Neighborhoods experience gentrification when an influx of investment and changes to the built environment leads to rising home values, family incomes and educational levels of residents. Cultural displacement occurs when minority areas see a rapid decline in their numbers as affluent, white gentrifiers replace the incumbent residents.
In this study, neighborhoods were considered to be eligible to gentrify if in 2000 they were in the lower 40 percent of home values and family incomes in that metropolitan area.
Measuring gentrification and displacement is fraught with controversy, since people who are impacted by the economic and social transition of their neighborhoods feel the disruption of community ties directly. This study measured gentrification and displacement using empirical methods and data, which has its own flaws and limitations. First, while the use of U.S. census data improves the validity of the study’s findings, it also restricts the population analysis to a time period extending from 2000 to 2010, while the social and economic data were gathered under the U.S. Census American Community Survey (ACS) program, covering the period starting in 2000 and until 2009-2013, a five-year consolidation of the social and economic data. This limits our findings to the not-too-distant past. However, neighborhoods with a more recent dynamic of gentrification and displacement could not be covered. Second, the use of census tracts, which average about 4,000 residents, as a proxy for neighborhoods could disguise neighborhood changes taking place at smaller community sizes. As a consequence of these restrictions on the time frame and scale of the study, it should not be implied that other neighborhoods have not experienced the same effects before, during or since the study period. Instead, the study is designed to identify instances of gentrification and displacement that can be measured with a high level of confidence, and avoid falsely noting gentrification where none occurred, but it cannot capture the full-lived reality of residents in gentrifying neighborhoods.
Disinvestment in low- and moderate-income communities results from a long history of discrimination in lending, housing and the exclusionary, racialized practice known as redlining[3]. A recent study by the Federal Reserve Bank of Chicago directly linked community disinvestment with historical redlining practices evident in the Home Owners Loan Corporation (HOLC) residential security (“redlining”) maps, completed for all major cities of the U.S. 80 years ago[4]. A 2018 study by NCRC found that three out of four neighborhoods marked “hazardous” by HOLC surveyors in the 1930s are still struggling economically, with lower incomes and higher proportions of minority residents. The economic outcomes for black and Hispanic families residing in disinvested areas are often stunted by lower incomes, fewer businesses and fewer opportunities to build wealth. This history set the stage for gentrification and displacement.
Local advocates and officials should pursue policies that encourage investment while promoting the ability of existing residents to stay and benefit from revitalization. In our 2016 paper, The Community Reinvestment Act: How CRA can promote integration and prevent displacement in gentrifying neighborhoods, we identified several ways in which local stakeholders can promote revitalization to benefit the broader community, such as partnerships between banks and community-based organizations to encourage equitable development; limited-equity co-ops and community land trusts; providing existing tenants with the right of first refusal in apartment conversions coupled with low-income and first-time buyer financing programs; inclusionary zoning regulations; and split tax rates for the incumbent residents of gentrifying neighborhoods. Additionally, HUD’s Affirmatively Furthering Fair Housing (AFFH) process provides an opportunity for community groups to engage with municipal leadership in the planning process. AFFH provides a mechanism for identifying areas that are vulnerable to, or may be in the early stages of, gentrification. Community groups can then work to develop strategies to avoid displacement of incumbent residents by attracting investment and providing affordable housing.
Large and small local banks can also play a role by supporting the development of housing and finance options that accommodate the retention of low- and moderate-income families in the community, rather than excluding them. Bank regulators should recognize pro-integrative bank finance as responsive to the needs of the community, crediting banks for these efforts in their CRA exams. Strategies like those advanced through HUD’s AFFH rule, promoting investment in inclusive and diverse neighborhoods, should be eligible for CRA consideration. It is essential that programs promoting the economic prosperity of incumbent residents of gentrifying neighborhoods be discussed on the public evaluations released subsequent to a CRA exam to document their effectiveness and encourage other banks to apply comparable investment strategies in their markets.
INTRODUCTION
Any discussion of gentrification is likely to elicit a range of responses. A conversation with an NCRC member living in an impoverished and high-crime neighborhood in Baltimore, Maryland, culminates with a plea: “When can we get some of that (gentrification) in my community?” Another NCRC member from Portland, Oregon, experiences gentrification as an erosion of community ties, as rents escalate and families are displaced. In Arlington, Virginia, a large rental community of 3,000 mostly Hispanic immigrants drawn by a robust Washington, D.C., economy is uprooted when the property is sold, bulldozed and replaced by a mix of luxury and affordable apartments, which are neither truly affordable nor plentiful for the former tenants[5]. In the rapidly gentrifying Shaw neighborhood of Washington, D.C., the Lincoln Temple United Church of Christ, a congregation that had existed since the 1860s and was a landmark of the Civil Rights struggle, is forced to dissolve in 2018 as its membership drops to just 20 congregants[6]. Gentrification is controversial because it affects people at the neighborhood level, it can disrupt the familiar and established ties of a place, creating a disorienting new locale. For people displaced as the neighborhood becomes unaffordable, this is more than just nostalgia or discomfort with the unfamiliar. Often, they must accept longer commutes and a disruption of the support structures provided by their old neighbors and family. In these cases, gentrification is understood as the terminal stage of exclusion of minority (usually black) residents from affordable housing inside the city. Public policy measures starting with “slum clearance” in the 1930s and 1940s then became “urban renewal” (Collins & Shester 2012; Hyra 2012) and construction of the highway system, which split communities in the 1950s, 1960s and 1970s (Mohl 2004: Karas 2015), which then became “redevelopment” in the 1980s and 1990s. Now, the remnant of these communities face an affordability crisis as affluent, usually white gentrifiers with access to credit move in and transform the economic and social dynamics of a community.
While community perceptions of gentrification range from hope for better living conditions to anxiety and even hostility, research on gentrification is divided on whether displacement is an inevitable outcome. Some researchers assert that gentrification attendant with displacement is a complex issue and while mobility rates of low-income residents are equivalent in gentrifying and non-gentrifying areas, low-income families are unable to afford to move in and replace exited families as housing costs escalate (Ding, Hwang, and Divringi, 2015). Other researchers found that displacement was rare (Ellen and O’Regan, 2011; Freeman 2005), while others comment on its prevalence (Newman and Wyly, 2006). This divergence of opinion could be because both the scale and type of gentrification vary from place to place. The urban form, or patterns of land-use in U.S. cities, differ considerably in size and structure, and the process of gentrification can involve neighborhoods in a rapid process of change or unfold over decades in larger districts. Additionally, while the residential and commercial aspects of a community are interwoven, gentrification of residential and commercial areas involve slightly different dynamics (Meltzer 2016). Displacement also may take different forms: either racial/ethnic or by class and culture. Finally, Marcuse (1986) argues that in many cases displacement due to systematic urban disinvestment, which resulted in the abandonment of many downtown neighborhoods, often precedes gentrification. For all of these reasons, it is helpful to be clear about the type of gentrification considered, how it is being studied and over what period.
The focus of this report is residential gentrification and racial and ethnic displacement throughout urban areas of the U.S. It is a comprehensive national level analysis of gentrification and displacement in 935 metropolitan areas. The goal was to determine how widespread gentrification was in U.S. urban areas, and then identify neighborhoods where gentrification and displacement occurred simultaneously. The first step of this analysis is to find neighborhoods with indications of gentrification. Utilizing a methodology developed by Columbia University Professor Lance Freeman, the study examines increases in education levels, home values and income as the defining criteria of whether gentrification has occurred in a neighborhood (2005). We determine which neighborhoods (census tracts) show indications of gentrification over the period from 2000-2013. In tracts with indications of gentrification, a second analysis is conducted to examine whether racial/ethnic displacement occurred during the same time period. The research questions addressed by this study are: 1) How prevalent is gentrification and subsequent displacement? 2) Are there regional differences in gentrification and displacement? 3) What census variables are associated with gentrification across the nation?
LITERATURE REVIEW
The term “gentrification” was first coined in the 1960s by British sociologist Ruth Glass (1964) to describe the displacement of the working-class residents of London neighborhoods by middle-class newcomers. From its inception, gentrification has been understood as a form of neighborhood change, resulting in the displacement of incumbent residents of one social class and culture by another more affluent class, linked with an increase in property values. In the case of the United States, the segregated residential structure of American cities creates circumstances in which gentrification often occurs along racial lines. In these cases of gentrification and racial displacement, affluent white incomers often displace the incumbent minority residents.
Gentrification is a complex form of neighborhood change. At the street level, it is visible in the upgrading of the built structure of neighborhoods, as houses are refurbished and businesses established (Krase, 2012; Kreager, Lyons and Hays 2011; Papachristos et al. 2011). While the most basic understanding of gentrification involves the movement of people and investment to affect neighborhood change, it also involves broader political and economic forces. Policy decisions by governments impact both transportation and the availability of services and amenities in a community. The interplay between government and the public in decisions regarding zoning and the allocation of public resources, coupled with decisions by private developers on the investment of capital, deeply influence neighborhood desirability (Zuk et al. 2015). The forces driving neighborhood changes, like gentrification, also involve an interplay between the movement of people, public policy decisions and the availability of capital. Consequently, gentrification is a subject that requires analysis of social, political and economic circumstances.
The economic drivers of neighborhood change involve supply-side dynamics of public investments and land value within the context of the wider metropolitan economy. While working on his PhD at Johns Hopkins University, the late Neil Smith observed the gentrification of Baltimore’s Inner Harbor (1979). This stirred him to establish the drivers that lead to gentrification in terms of land rents – the depreciation and physical deterioration of older built structures, and the increase in the potential income returns from the land on which they were built. When the potential income return from land rents exceeds the perception of risk by investors, neighborhoods become likely candidates for redevelopment. While economics explain the flows of capital to gentrifying commercial and residential areas, there are broader cultural factors that have shifted perspectives on the desirability of an urban lifestyle and increased the demand for downtown locations.
Neighborhood lifestyle preferences have always had a powerful role in establishing the desirability of different urban locations. The post-war era saw a shift in both federal policy and consumer culture that had enormous impact on urban residential patterns (Cohen 2004). Economic conditions of the Depression era and production priorities during World War II hindered construction of new housing for over a decade. This contributed to an antiquated stock of urban housing, the supply of which was too small to meet demands of a growing and increasingly affluent population in the post-war era. The availability of mortgage financing through the Housing Act of 1949 sparked a construction boom. Much of the housing was built in suburbs, where developers utilizing economies of scale could find large undeveloped tracts for massive new developments. This accelerated a reconfiguration of the American urban system, as white middle-class residents suburbanized, shifting population and capital away from downtown areas (Jackson 1987). Often, this left the downtown areas of cities with high proportions of minority and low-income residents, resulting in a reduced revenue base and greater demands for city services. This shift in economic prosperity and population away from the downtown areas of cities has become widely accepted as a theory of post-war urban decline; however, urban development varied greatly across the country and should not be taken as the sole explanation of post-war urban development (Beauregard 1993). In the present era, the aging housing stock of inner-ring suburbs has become less desirable as the demands of commuting and allure of downtown amenities have shifted demand for housing closer to the central business district (CBD) of urban areas.
The question “who gentrifies?” is contingent on demographics and class. Many authors cite the role of young millennials in gentrification (Hwang & Lin 2016; Baum-Snow & Hartley 2016; Couture & Handbury 2016; Ding, Hwang & Divringi 2015). Millennials are less likely to harbor racial and ethnic animosity than previous generations (Freeman & Cai, 2015; Owens, 2012; Glaeser & Vigdor, 2012). Many downtown areas of cities have also experienced reductions in violent crime over the last two decades, which could make certain low-income neighborhoods enticing to newcomers (Ellen, Horn & Reed 2016). Increasing work hours and reduction in leisure time has also created a demand to reduce commute time and work closer to home (Edlund, Machade, & Sviatchi 2016). Public policy decisions also have impact. Several researchers cite the role of the HOPE VI program in the demolition of distressed public housing (Goetz 2013; Vale & Gray 2013). Shifts in city level spending on mixed-income developments, parks and bike share enhance downtown desirability (Buehler and Stowe, 2016; Hyra 2012; Tissot, 2011). Finally, many city leaders have acted on the advice of influential urban planners, like Edward Glaeser and Richard Florida, who popularized the idea that the amenities of the downtown areas of cities draw Gen-Xer’s and Millennials who are part of an affluent “creative class” that revitalizes neighborhoods (Clark, 2011; Florida, 2014; Glaeser & Shapiro, 2003). A combination of undervalued property and changing cultural perceptions about the desirability of urban living increases the demand for residences in downtown areas of many U.S. cities.
While gentrification implicitly involves economic transition as a more affluent class replaces the incumbent residents, many researchers also note that there are cultural and racial dimensions to this form of neighborhood change. Millennial perceptions about race have shifted from those of prior generations, so that minority neighborhoods are now seen as “cool and edgy” (Hyra 2016), but that does not necessarily mean they remain inviting or affordable for the incumbent residents. Several researchers found that neighborhoods transitioning to affluence create new social tensions that influence interactions, which can often result in micro-level segregation (Chaskin & Joseph, 2015; Tach, 2014; Hyra 2015). The new residents might shift the community’s focus of concern and the dynamics of political power, including black and white middle-class gentrifiers wielding political influence in local initiatives that sometimes oppose the expansion of affordable housing in their new neighborhoods (Boyd 2005; Hyra 2008; Pattillo 2007).
Despite many studies on the issue a crucial question remains, does gentrification also mean displacement? The economics of gentrification explicitly state that neighborhood property values increase, decreasing the supply of affordable housing available to lower-income residents who are then displaced, as the cost of living in the neighborhood increases. However, several studies indicate that the mobility rates of low-income people are equivalent in gentrifying and more stable low-income neighborhoods (Ding, Hwang & Divringi, 2015; Ellen & O’Regan, 2011; Freeman, 2005; Freeman & Braconi, 2004; McKinnish, Walsh & White, 2010). Some cite this as evidence that widespread displacement is not occurring. However, Hyra (2016) argues that this is an incorrect interpretation that merely shows that low-income rates of mobility are uniformly high across all types of neighborhoods. It’s not that displacement is not occurring in gentrifying neighborhoods, but that in general low-income people move more often. Additionally, the movement of other low-income residents back into gentrifying neighborhoods is constrained by a lack of affordable housing (Ding, Hwang & Divringi, 2015). Over time, the neighborhood experiences a net loss of low-income residents as housing costs rise, and the neighborhood becomes less and less affordable. This transition in the economic status of neighborhoods often occurs along racial lines, as incumbent low-income black and Hispanic residents move and are replaced by higher-income white gentrifiers. Freeman (2005) found a surge in white movement into black neighborhoods since 2000.
The influx of affluent white gentrifiers to formerly low-income minority neighborhoods can be viewed as a form of racial exclusion from urban areas with vibrant economies. There has been increased exclusion of incumbent black homeowners from gentrifying neighborhoods, driven by racial disparities in access to home lending. Black and Hispanic applicants for mortgages in gentrified neighborhoods were 2.32 times and 1.96 times more likely to be denied credit than non-Hispanic white applicants between 1993 and 2000 (Wyly & Hammel 2004). Neighborhood level disparities in access to mortgage credit access have a long history and have been documented in several cities by NCRC (Richardson et al. 2015 & 2016). Rothstein (2017) documents the history of redlining going back to the early part of the 20th century. A combination of local policies related to zoning, restrictive covenants, prohibition of lending in “hazardous” neighborhoods and informal segregationist practices like residential steering and social pressure prevented residents of low-income and minority neighborhoods from gaining access to credit. This pattern of disinvestment prepared the ground for gentrification and displacement in many neighborhoods (Marcuse 1986). Gentrification, which decreases the supply of affordable housing, coupled with policies of public housing demolition (Goetz 2013), have resulted in the displacement of racial minorities and low-income residents in some cities.
METHODS
This study sought to quantify variations in displacement in U.S. urban areas by assessing changes at the census tract (neighborhood) level using nationwide U.S. census data normalized by the longitudinal tract database (LTDB)[7]. Normalization of the census data is necessary because tract boundaries can change over time, leading to inaccuracies. We analyzed LTDB data for socioeconomic changes during the period 2000 to 2013 for all 50 U.S. states. Population changes were assessed using decennial census data for 2000 and 2010, which was normalized by the LTDB.
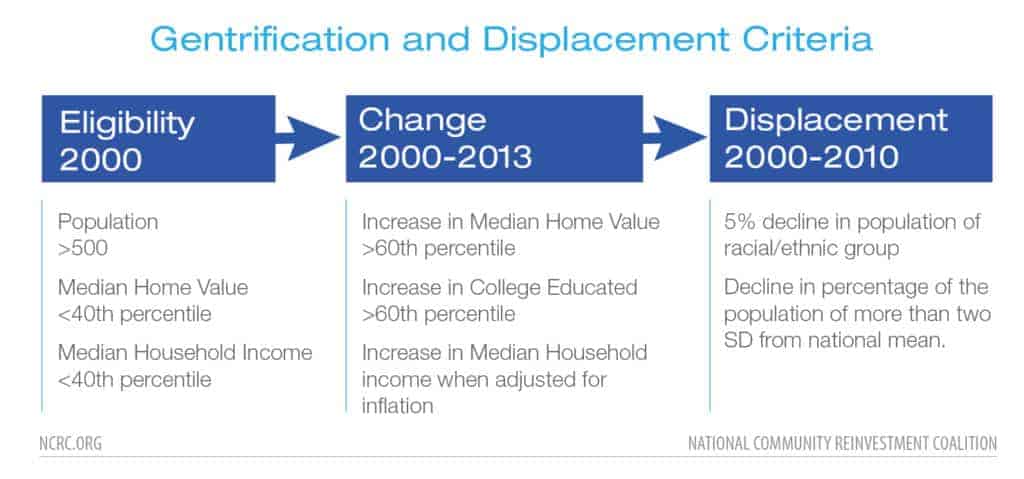
Researchers have used several different methods to identify neighborhoods that seem to be experiencing gentrification and to then assess rates of residential change. The study adopted a methodology developed by Freeman (2005) and utilized by the Philadelphia Federal Reserve (Ding, Hwang & Divringi, 2015) and Governing.com (2015) to locate gentrified areas. The method involves assessing the educational level and economic status of residents, and the value of properties in the neighborhood at the beginning of the census period, then assessing changes in the next U.S. census. This includes several checks:
- Eligibility determined by tracts in the Core Based Statistical Area (CBSA), which are below the 40th percentile in both median household income and median house value. In addition, the population must be 500 residents or greater at the beginning of the period.
- Possible gentrification is determined by including all eligible tracts and then identifying tracts that were in the top 60th percentile for increases in both median home value and the percentage of college graduates.
- Determining tract level median household income increases from 2000-2013 when adjusted for inflation is the final check.
- Census tracts meeting all of the above listed criteria were then identified as undergoing, or having undergone, gentrification.
The criteria for gentrification are all indications that the socioeconomic status of the residents of the tract shifted. We then reviewed each tract for changes in the population of the racial subgroups[8]. These changes were assessed using two criteria;
- Did the racial group’s percentage of the population decline by more than two standard deviations from the mean of all census tracts?[9]
- Did the absolute number of residents from that racial group decline by at least five percent?
If the census tract gentrified and met both of these criteria, we identified it as having experienced cultural displacement[10] (Figure 1). Cultural displacement results when the tastes, norms and desires of newcomers supplant and replace those of the incumbent residents (Zukin 2010). Since this kind of cultural transformation of neighborhoods is difficult to measure directly, the decline in minority subpopulation was used as a proxy. Population shifts were examined utilizing decennial census 2000 and 2010 population data.
RESULTS
National changes – Gentrification
Nationally, 90.7 percent, or 67,153 census tracts have a micropolitan or metropolitan designation, and are assigned to an urban area. Of these urban tracts, 16.7 percent or 11,196 tracts met the criteria for being eligible for gentrification in 2000, the beginning of the examination period (Figure 2). A total of 1,049 census tracts met all three of the checks for gentrification: increases in median home value, educational attainment and increases in income by 2013. This amounts to nine percent of the eligible urban census tracts across the U.S. While this seems to indicate that gentrification is rare, the selection criteria was stringent and limited to a relatively short period of time. Gentrification appears to be clustered in sections of larger and economically vibrant cities that are close to central business districts. Residents are drawn to the neighborhoods by proximity to employers, and the clustering of amenities and services associated with an urban lifestyle. Finally, displacement was indicated in 232, or 22 percent, of the gentrified tracts.

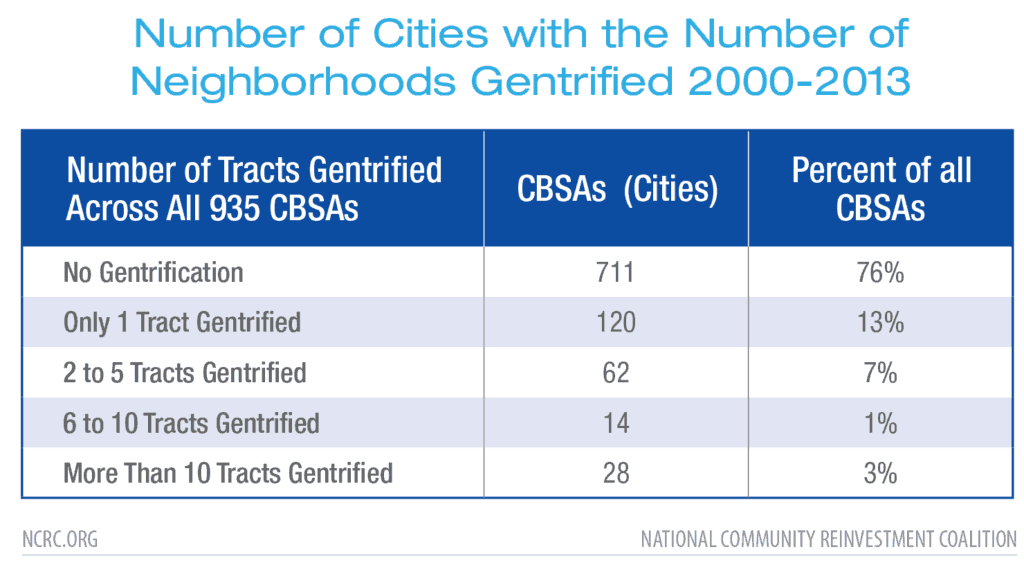
While gentrification impacted a minority of census tracts in U.S. cities, it was quite concentrated in the largest urban areas. At the national level, almost a quarter (24 percent) of all urban areas, or CBSAs, saw at least one tract gentrify between 2000 and 2013 (Table 1). CBSAs are urban areas with a population of at least 10,000 and include small micropolitan areas, analogous to towns, and larger metropolitan statistical areas (MSAs), or cities. In 13 percent of towns and cities, only one tract gentrified. More moderate levels of gentrification, between two and 10 tracts, occurred in eight percent of towns and cities. Intensive gentrification, cases in which more than 10 tracts underwent gentrification between 2000 and 2013, occurred in three percent of towns and cities nationally.
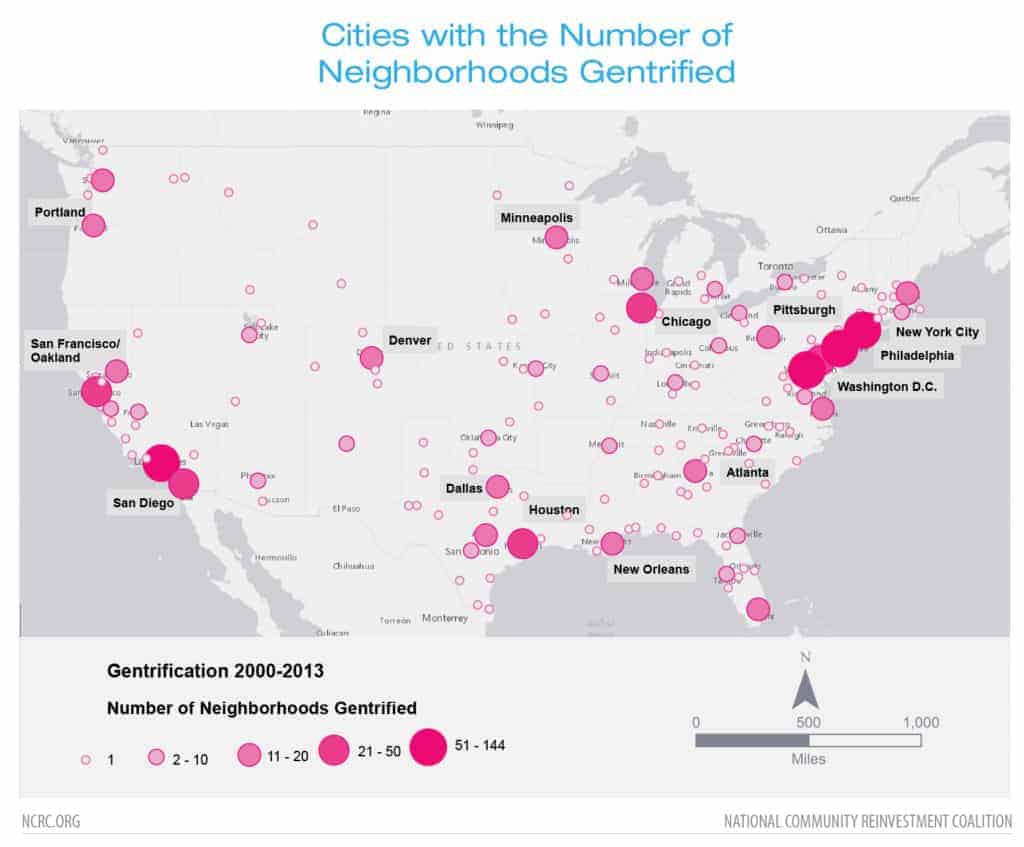
We assessed the population sizes of cities in which gentrification was occurring. Gentrification was concentrated in the largest urban areas. CBSAs with a population of one million or greater contained 79 percent of gentrifying tracts. Cities with populations between 500,000 and 1 million comprised another seven percent. Cities with populations between 100,000 and 500,000 contained 10 percent of gentrifying tracts. The smallest cities and towns, under a population of 50,000, contained only four percent of the tracts that gentrified nationally (Figure 3). The map shows that while coastal cities had the largest amount of tracts undergoing gentrification, large cities in the interior like Atlanta, Dallas, Denver, Minneapolis and Pittsburgh also underwent extensive gentrification.
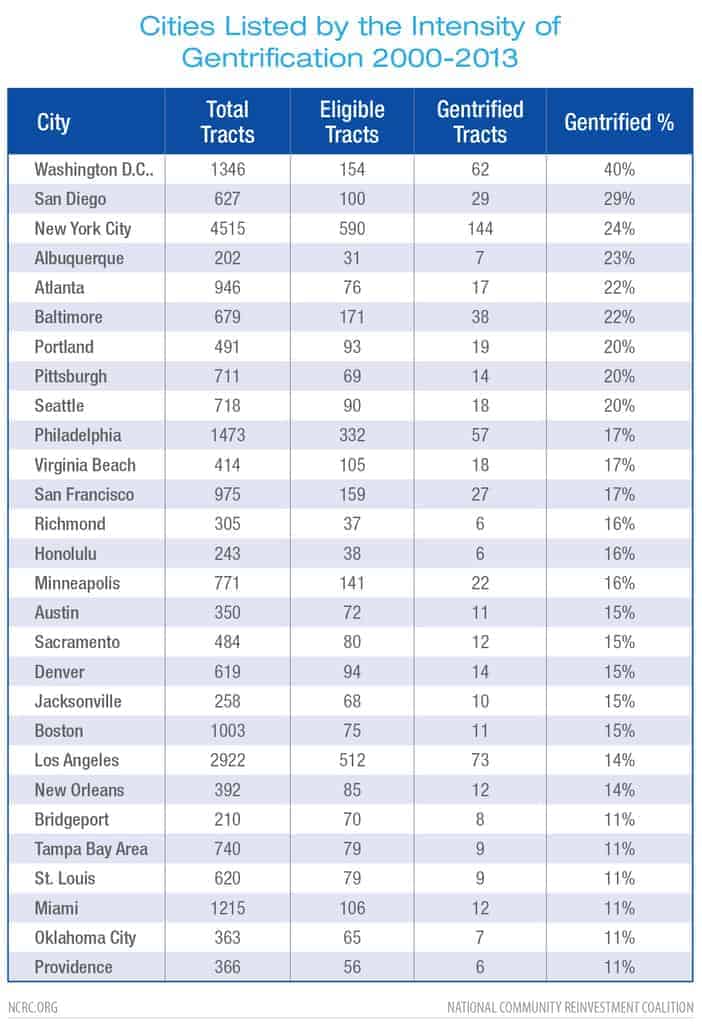
Cities with the highest rates of gentrification included New York City, Los Angeles, Washington, D.C., Philadelphia, Baltimore, San Diego and Chicago (Figure 4). These seven cities accounted for nearly half of the total gentrification nationally, or 501 tracts out of 1,049. It is surprising that Baltimore and Philadelphia metro areas are in the top 10 list, with the fourth and fifth largest number of gentrified tracts in the study, since these cities are not considered among the nation’s most economically dynamic cities. Different patterns of gentrification seem to be evident for the three largest cities (New York City, Los Angeles, Chicago), compared with the next three largest (Washington, D.C., Philadelphia, Baltimore).
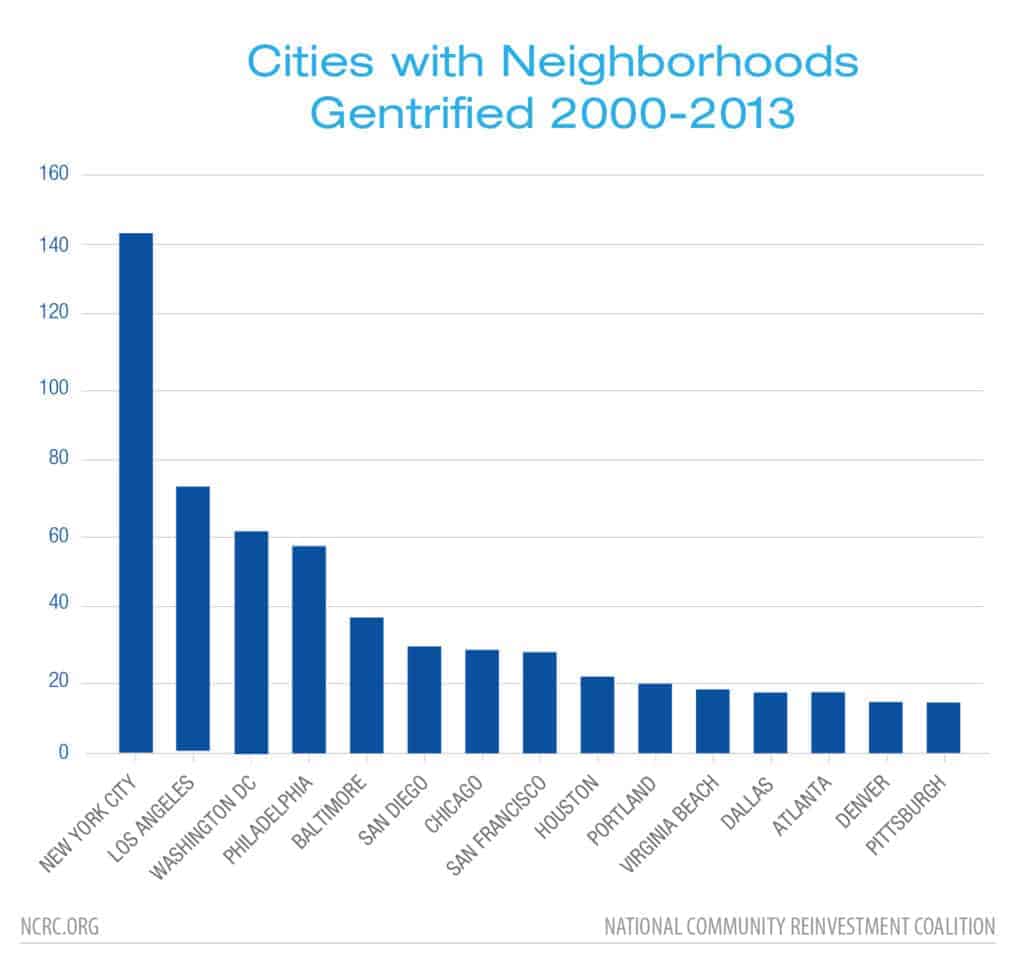
The three largest metro areas (New York City, Los Angeles, Chicago) are in the top seven for the number of neighborhoods which gentrified in Figure 4. The top tier cities in population size have many more neighborhoods, and may be more economically dynamic than second tier and third tier cities. Examining cities by the proportion of neighborhoods eligible in 2000 and which did gentrify over the next 10 years provides a more meaningful indication of the rates of gentrification in some areas (Table 5). Washington, D.C., was the city with the highest percentage of gentrifying neighborhoods, with San Diego, New York City, Atlanta, Baltimore and Portland also having both high numbers of tracts and high rates of gentrification.
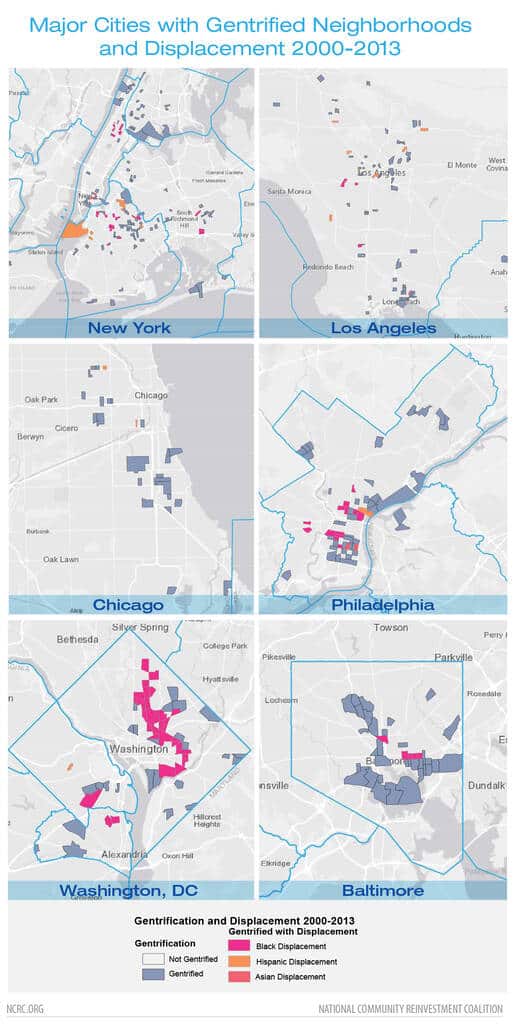
Examining the maps of different cities reveals patterns of concentrated gentrification in some, but more diffuse patterns in others. Analysis of the Baltimore map (figure 5f) indicates the concentration of gentrification around the Inner Harbor that then stretches from downtown north to Johns Hopkins University. Baltimore, Philadelphia and Washington, D.C., all show concentrated gentrification around their central business districts, while the pattern of gentrification is more scattered in the largest three cities: Chicago, Los Angeles and New York City (Figures 5a-f).
National changes – Displacement
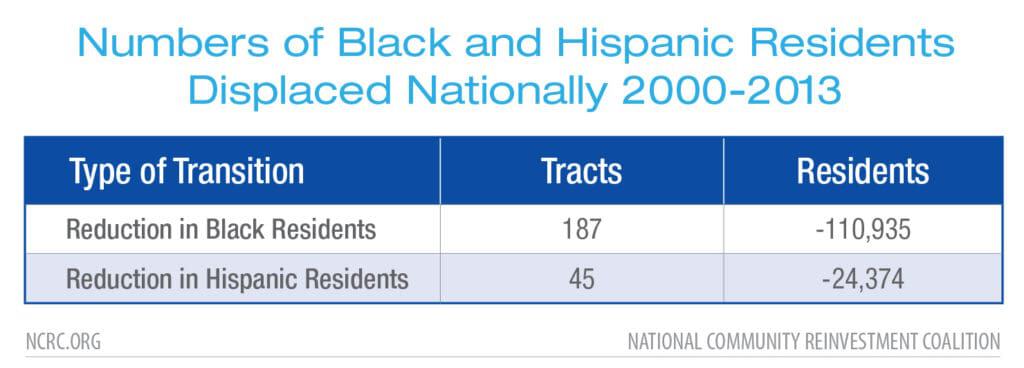
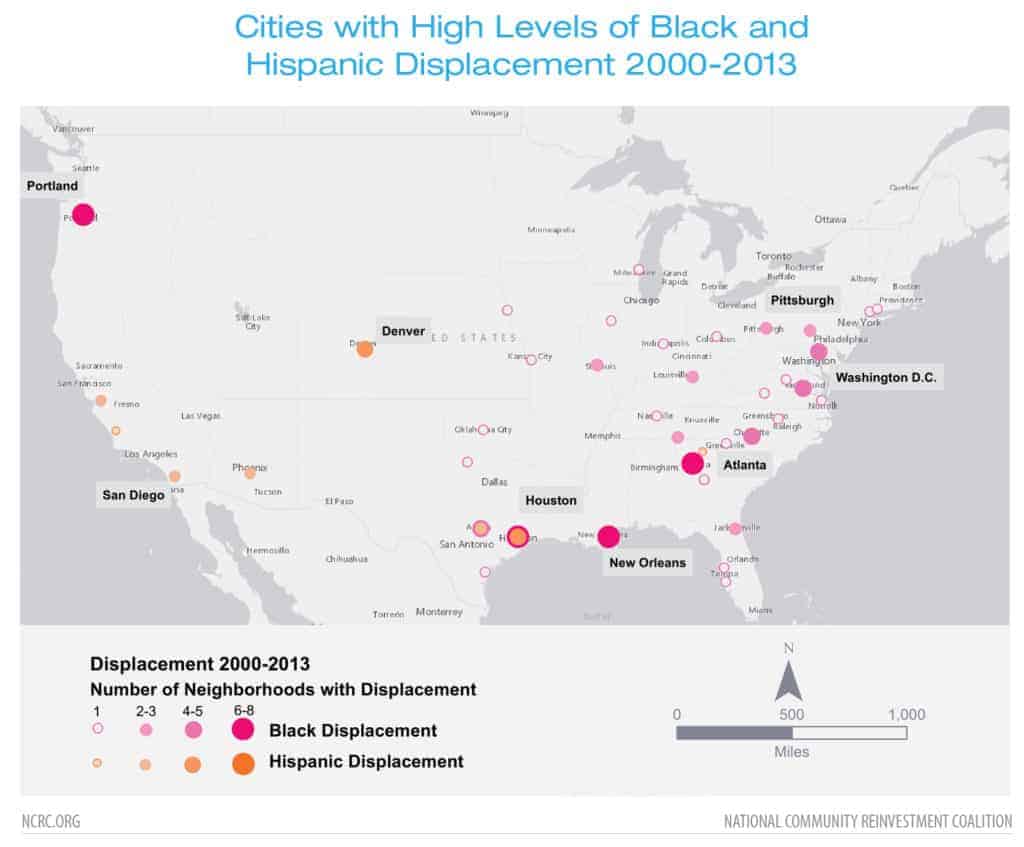
Cultural displacement was examined by calculating the reduction of black and Hispanic residents in census tracts. Nationally, 187 of the gentrified tracts showed some level of black displacement, and 45 tracts showed Hispanic displacement (Table 3). This impacted over 135,000 people nationally. While white residents increased in most tracts, there were instances in which the Asian and Hispanic residential population increased in tracts experiencing gentrification and black residential population declined.
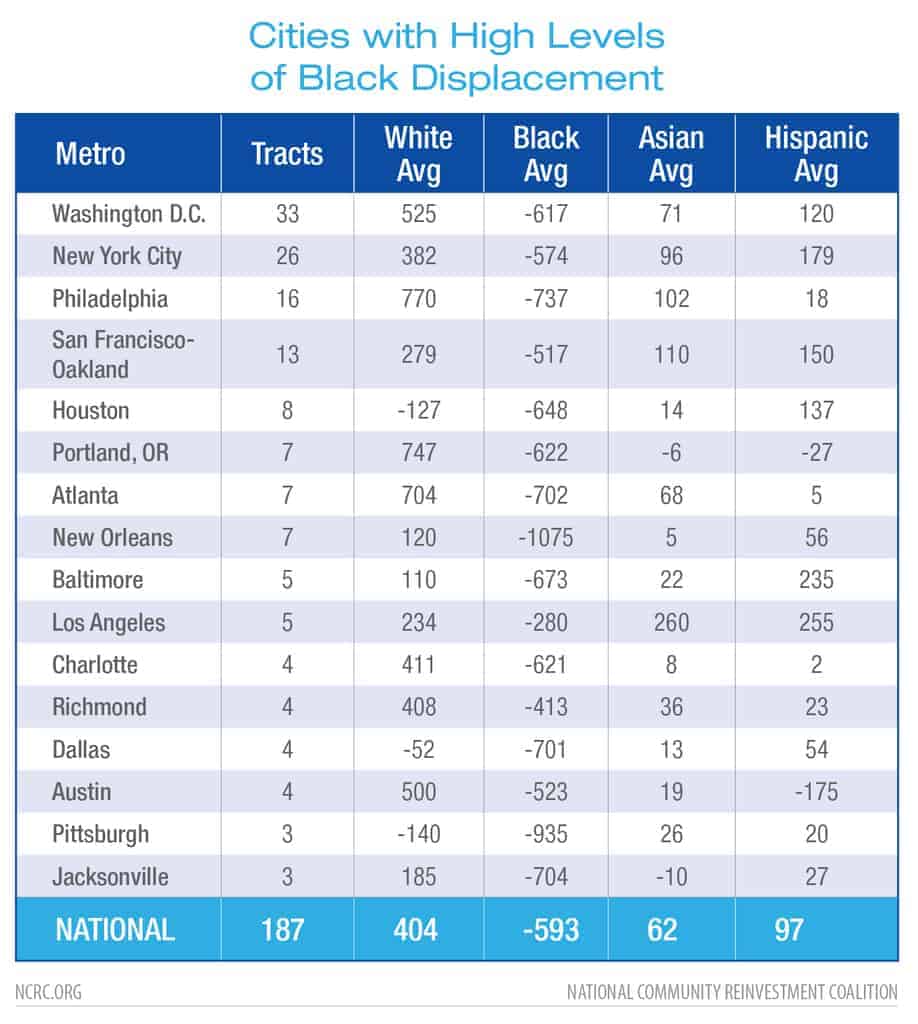
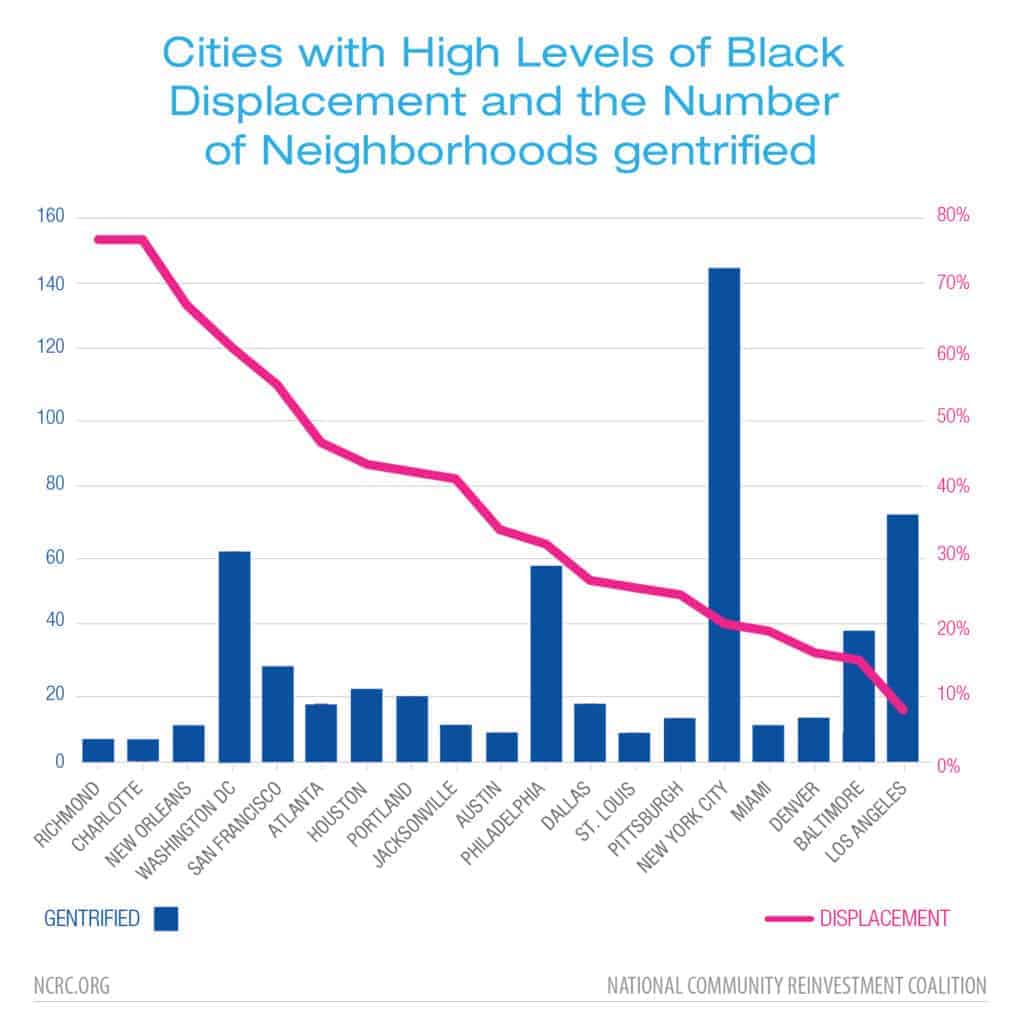
Next, we calculated the average losses in metro areas that experienced gentrification and black or Hispanic residential population loss. In the case of black residential displacement, the average loss per tract was 593 black residents (Table 4). New Orleans experienced the most average loss, 1,075 black residents per tract, largely attributable to massive dislocation of neighborhoods caused by the Hurricane Katrina disaster in 2005. Black residential losses in Washington, D.C., New York City and Philadelphia were especially acute due to the high number of tracts involved and their large displacement numbers. More than 20,000 black residents of Washington, D.C., nearly 15,000 in New York City and 12,000 in Philadelphia moved out of gentrifying neighborhoods.
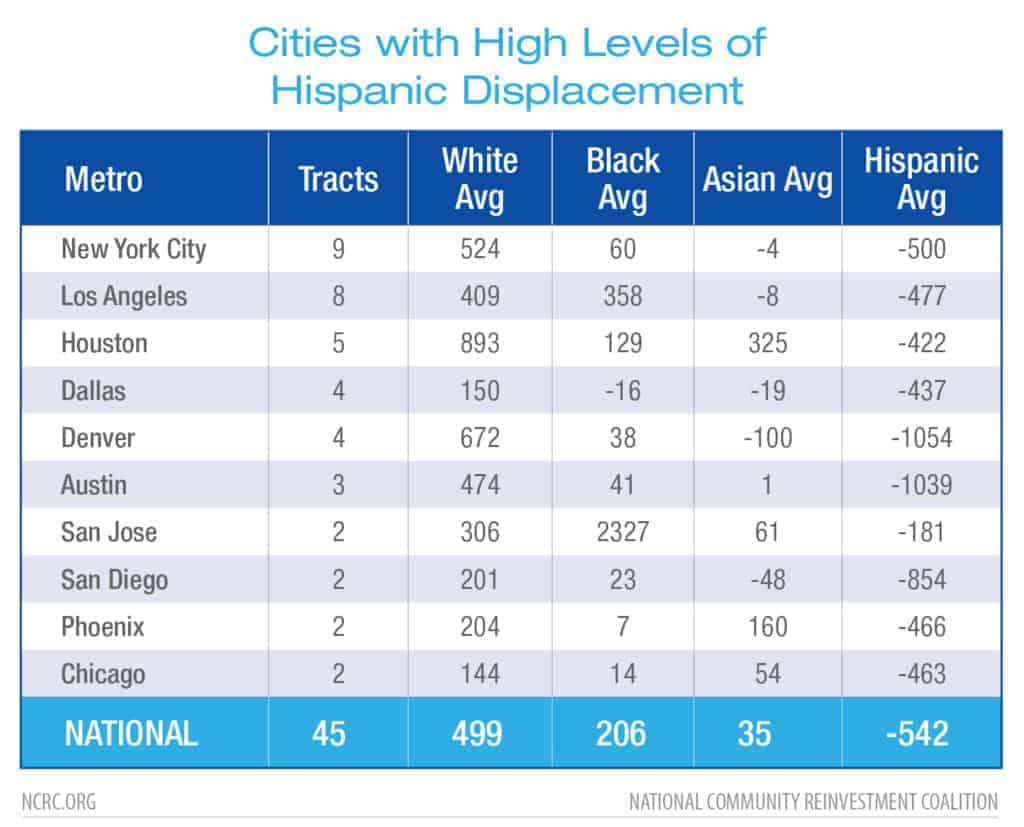
Tracts with indications of Hispanic displacement were much fewer than those with indications of black displacement, though the average number of displaced residents per tract was similar. In the 45 tracts with indications of Hispanic displacement, the average residential decrease was 542. Denver and Austin had the highest average decreases of Hispanic residents in gentrifying tracts with 1,054 and 1,039 respectively (Table 5).
In order to examine regional differences in black and Hispanic displacement from gentrifying tracts, we calculated the percentage of gentrifying tracts and tracts with indications of displacement. Cities with the highest levels of black displacement between 2000 and 2010 were concentrated in the South, with nine out of 16 cities with high levels of black displacement located there (Figure 6). Richmond, Charlottesville, Washington, D.C., and New Orleans had the highest percentages of black displacement at the tract level (Figure 6). While Richmond and Charlottesville had moderate levels of gentrification, at least half of the gentrifying tracts in those cities also experienced displacement.
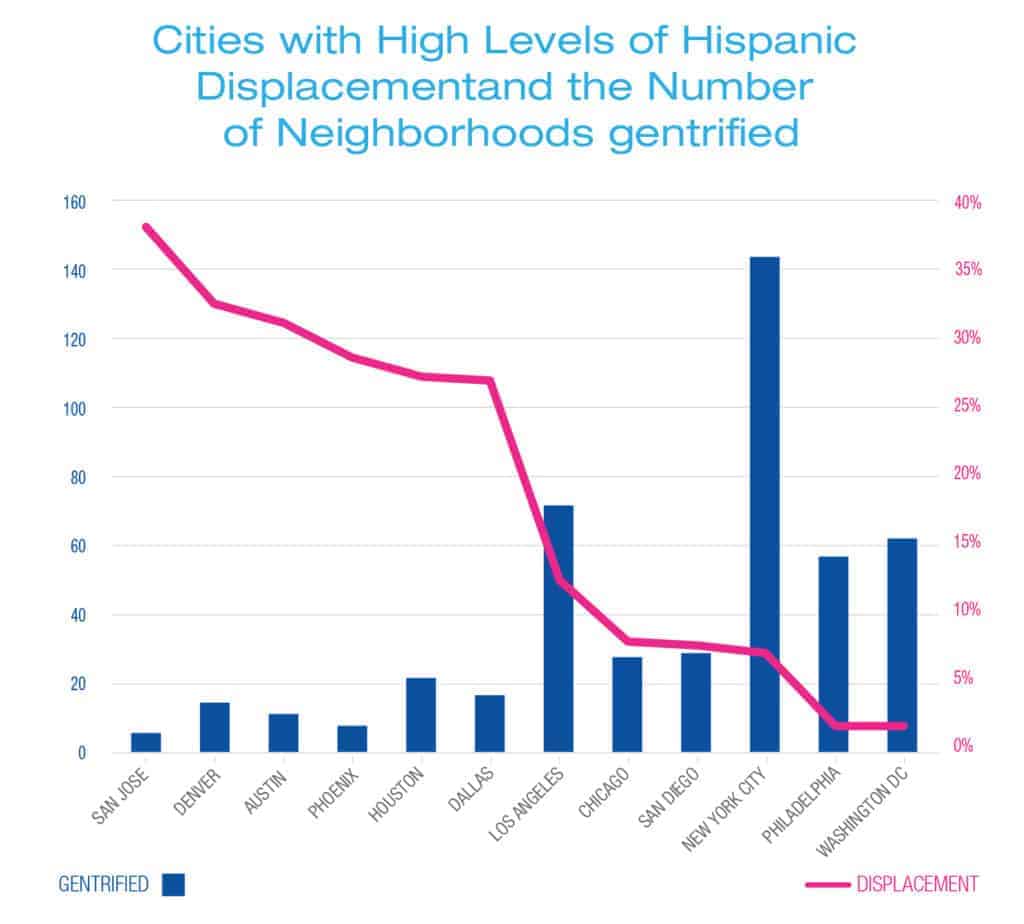
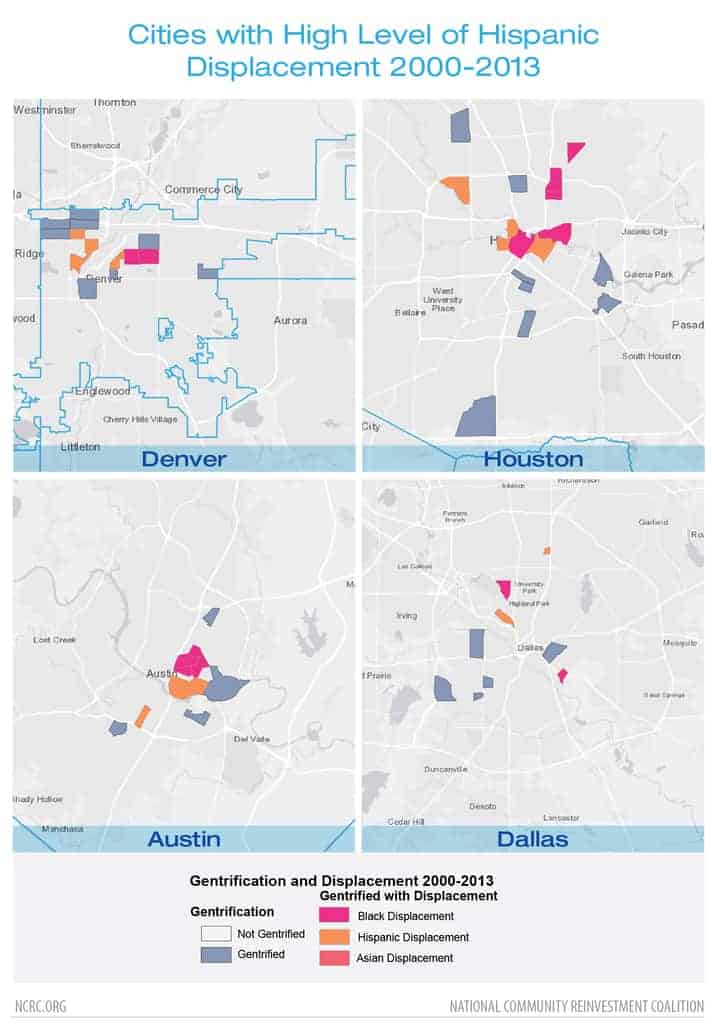
Hispanic displacement occurred in fewer cities than black displacement, and affected 45 census tracts nationally. The city with the largest number of tracts impacted was New York City, where nine tracts had losses indicative of Hispanic displacement. Aside from New York City, Hispanic displacement was most intense in the West, with Denver, Austin, Houston and Dallas having the highest percentages followed by Los Angeles (Figure 7). However, the number of affected tracts were small: five in Denver; four in Austin, Dallas and Houston; and eight in Los Angeles. This difference in the rate of Hispanic and black displacement might be attributed to the high rate of suburbanization for the Hispanic population of those cities, since nationally, 45 percent of Hispanic residents live in areas outside the downtown core. Suburbanization rates of black residents are lower at 39 percent (Massey & Tannen, 2018). The levels of segregation from non-Hispanic whites also diverge widely for the two demographic groups. The most common indicator of segregation is the dissimilarity index, which measures the evenness of the distribution of residents between two groups. At the national level, this index is much higher for white non-Hispanic and black residential areas at .60, than it is for white non-Hispanic and Hispanic residential areas at .40. The Hispanic population also increased quite rapidly over the study period, increasing from 12.5 percent of the population in 2000 to 16.3 percent in 2010. The black percentage of the population increased less, from 12.9 percent in 2000 to 13.6 percent in 2010. The lower levels of demographic displacement of Hispanic residents could be attributable to a combination of population growth, lower segregation relative to non-Hispanic whites and/or decreased frequency of gentrification in Hispanic-majority neighborhoods, which are more likely to be located in suburbs than black-majority tracts.
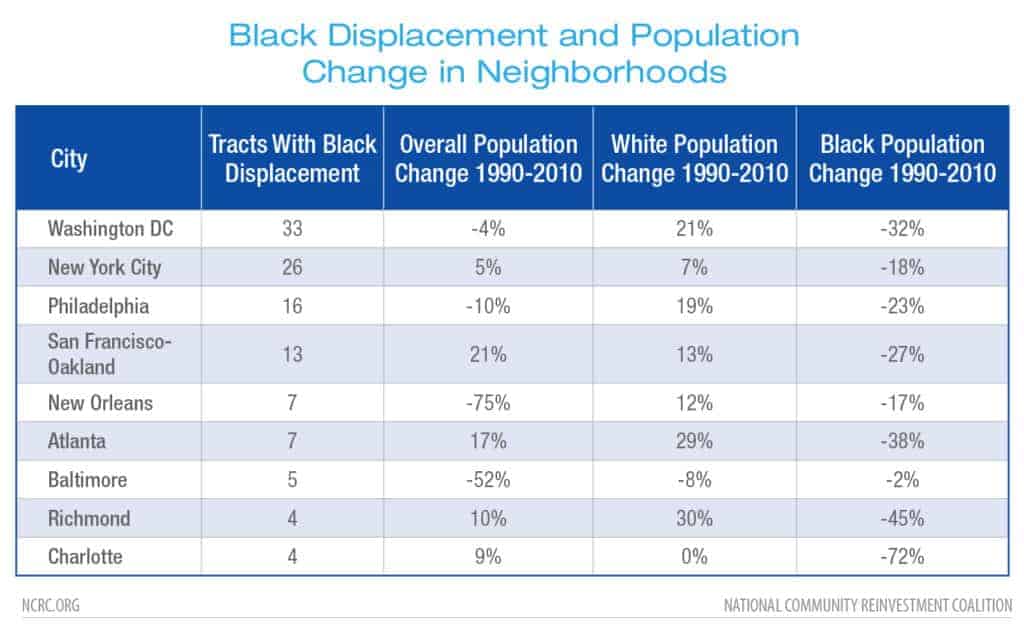
Critics of gentrification sometimes argue that long-term disinvestment and depopulation of neighborhoods established the economic and social conditions for later cultural displacement (Marcuse 1986). In order to test this, we examined cities with a high number of tracts with black displacement for long-term demographic shifts between 1990 and 2010 (Table 6). The 20-year study period was chosen to capture the impact of demographic changes unfolding over a longer time frame than gentrification, especially in instances where displacement actually preceded gentrification. In most cases, a pattern of decreasing percentages of black, and increasing percentages of white, residents occurred in gentrifying tracts. This tract-level pattern of black decreases and white increases in residents was especially prevalent in Washington, D.C., San Francisco-Oakland, Atlanta, New Orleans and Richmond. Many tracts also showed that there was long-term population loss, indicating abandonment of the area or reduced residential density before or during a demographic transition. This trend was apparent in Baltimore, but especially severe in New Orleans, where the Hurricane Katrina catastrophe forced widespread neighborhood abandonment. Philadelphia and Washington, D.C., had much lower levels of population loss in gentrifying tracts. The cities of Dallas, Richmond, New York City, and especially Atlanta and San Francisco, had high rates of population growth.
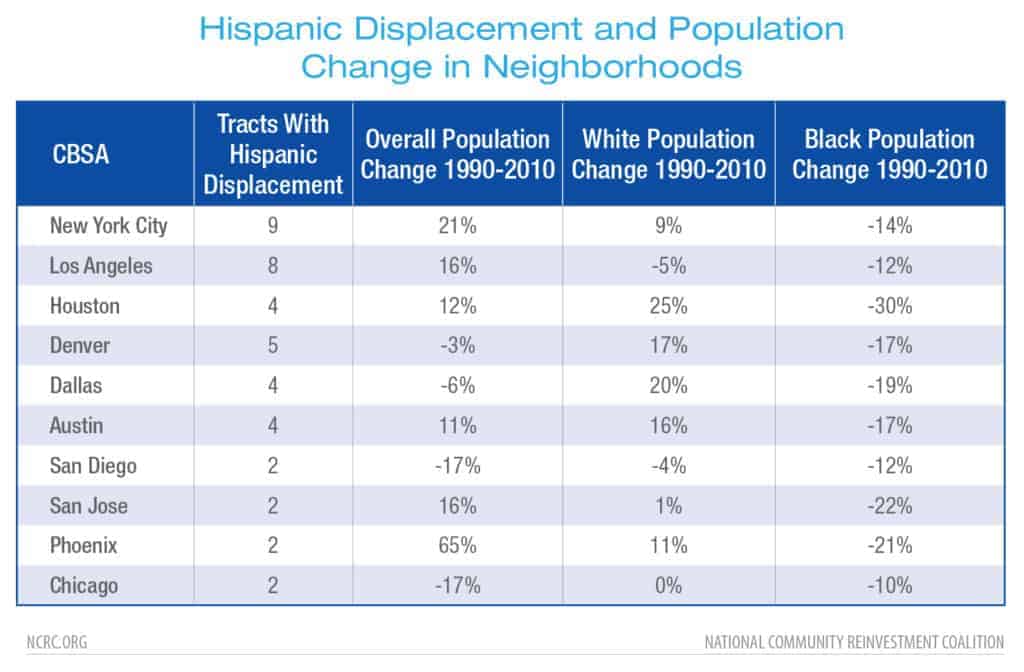
There were also notable declines in the Hispanic population and increases in white population in many cities between 1990 and 2010. The exceptions to this were in Los Angeles and San Diego (Table 7), where both white and Hispanic populations declined in gentrifying neighborhoods. Linkages between tract-level population loss and demographic change were evident in Denver, Dallas, San Diego and Chicago. Areas of Hispanic displacement in Denver, Houston, Austin and Dallas are shown in figures 8 a-d. All of these cities also contained tracts experiencing black displacement.
DISCUSSION & CONCLUSION
Past studies of gentrification and displacement have measured neighborhood change by assessing the rates of mobility of incumbent low-income residents in gentrifying areas. Generally, the results showed high but comparable rates of mobility for low-income residents in gentrifying and non-gentrifying tracts, but with low rates of low- income replacement in gentrifying tracts. Consequently, that method of analysis did not directly measure racial/ethnic displacement. This study used a different approach, examining shifts in the racial/ethnic composition of tracts in 2000 and 2010 in order to determine where gentrification and demographic changes were indicative of displacement. National rates of gentrification are low in towns and smaller cities, with 76 percent of urban areas not experiencing any gentrification under our criteria. This may be a conservative estimate due to the requirement of an absolute increase in household income. Another 13 percent experienced gentrification in only one neighborhood, while 8 percent of U.S. cities experienced moderate gentrification. However, the largest population centers experienced intensive gentrification with 3 percent of cities showing indications of gentrification in 10 or more tracts, and 79 percent of gentrifying tracts being within cities with one million or more residents. Though gentrification may be relatively rare at the national level, it can be intensive in the largest cities with dynamic economies. Coastal cities experienced the highest rates of gentrification, with seven out of the top 10 cities in total tracts gentrified being located on the East or West coast.
The Tax Cuts and Jobs Act of 2017 created 8,000 Opportunity Zones throughout the country to lure investment to struggling neighborhoods. Although those Opportunity Zones were not defined when this study began, preliminary analysis indicates that 70 percent of gentrified neighborhoods are within or adjacent to an Opportunity Zone. However, most Opportunity Zones do not appear to have been gentrified during the study period.
Some questions to investigate in the future: Will Opportunity Zone investments concentrate mainly in booming areas, and skip many others, as we found for gentrification. Will investments flow primarily into Opportunity Zones that are already gentrified, or adjacent to gentrified neighborhoods?
This study indicates that minority displacement is indeed occurring in many cities, where it is often concentrated in areas near the central business district. Displacement of minority groups was high in gentrifying tracts, with 22 percent having indications of high levels of either black or Hispanic residential loss. While larger cities experienced higher levels of gentrification, displacement also seemed to correspond with regional location. Southern cities experienced greater intensity of black displacement, while western cities experienced greater intensity of Hispanic displacement. Additionally, Washington, D.C., and Philadelphia were notable for their high levels of black displacement, while Denver and Austin had high levels of Hispanic displacement. These results indicate that gentrification is often accompanied by high levels of cultural displacement. Since the displacement portion of this study was limited to the decades before 2010, it is difficult to assess the proportion of minority neighborhoods which have indications of displacement that will lead to racial and ethnic integration, or resegregate and become white majority areas over time. It is essential to examine the economic and demographic changes which result from gentrification for their impact on equity at the neighborhood level.
REFERENCES
Baum-Snow, N. and Hartley, D., 2016, May. Causes and Consequences of Central Neighborhood Change, 1970–2010. In Research Symposium on Gentrification and Neighborhood Change (pp. 57-85).
Beauregard, R.A., 2001. Federal policy and postwar urban decline: A case of government complicity?. Housing Policy Debate, 12(1), pp.129-151.
Boyd, M., 2005. The downside of racial uplift: meaning of gentrification in an African American neighborhood. City & Society, 17(2), pp.265-288.
Buehler, R. and Stowe, J., 2016. Bicycling in the Washington DC Region. Capital Dilemma: Growth and Inequality in Washington, DC, pp.180-206.
Chaskin, R.J. and Joseph, M.L., 2015. Contested space: Design principles and regulatory regimes in mixed-income communities in Chicago. The ANNALS of the American Academy of Political and Social Science, 660(1), pp.136-154.
Cohen, L., 2004. A consumers’ republic: The politics of mass consumption in postwar America. Journal of Consumer Research, 31(1), pp.236-239.
Collins, W.J. and Shester, K.L., 2013. Slum clearance and urban renewal in the United States. American Economic Journal: Applied Economics, 5(1), pp.239-73.
Couture, V. and Handbury, J., 2017. Urban revival in America, 2000 to 2010 (No. w24084). National Bureau of Economic Research.
Ding, L., Hwang, J. and Divringi, W., 2015. Gentrification and residential mobility in Philadelphia. Federal Reserve Bank of Philadelphia Discussion papers. October. file. C:/Users/winifred/Downloads/discussion-paper_ gentrification-and-residential-mobility. pdf (accessed 20 November 2015).
Edlund, L., Machado, C. and Sviatschi, M., 2017. Gentrification and Rising Returns to Skill. https://www.gc.cuny.edu/CUNY_GC/media/CUNY-Graduate-Center/PDF/Programs/Economics/Other%20docs/GAll2017x11x13_1.pdf
Ellen, I.G. and O’Regan, K.M., 2011. How low income neighborhoods change: Entry, exit, and enhancement. Regional Science and Urban Economics, 41(2), pp.89-97.
Ellen, I.G., Mertens Horn, K. and Reed, D., 2016. Has falling crime invited gentrification? NYU Furman Center. http://furmancenter.org/files/NYUFurmanCenter_WhitePaper_FallingCrimeGentrification_18OCT2016.pdf
Florida, R., 2014. The creative class and economic development. Economic development quarterly, 28(3), pp.196-205.
Freeman, L., 2005. Displacement or succession? Residential mobility in gentrifying neighborhoods. Urban Affairs Review, 40(4), pp.463-491.
Freeman, L., 2009. Neighbourhood diversity, metropolitan segregation and gentrification: What are the links in the US?. Urban Studies, 46(10), pp.2079-2101.
Freeman, L. and Braconi, F., 2004. Gentrification and displacement New York City in the 1990s. Journal of the American Planning Association, 70(1), pp.39-52.
Freeman, L. and Cai, T., 2015. White entry into Black neighborhoods: advent of a new era?. The Annals of the American Academy of Political and Social Science, 660(1), pp.302-318.
Glaeser, E.L. and Shapiro, J.M., 2003. Urban growth in the 1990s: Is city living back?. Journal of regional science, 43(1), pp.139-165.
Glaeser, E. and Vigdor, J., 2012. The end of the segregated century. Manhattan Institute for Policy Research, January, pp.23-26.
Glass, R., 1964. Aspects of change. The Gentrification Debates: A Reader, pp.19-30.
Goetz, E.G., 2013. New Deal ruins: Race, economic justice, and public housing policy. Cornell University Press.
Hwang, J. and Lin, J., 2016. What have we learned about the causes of recent gentrification?. Cityscape, 18(3), pp.9-26.
Hyra, D.S., 2008. The new urban renewal: The economic transformation of Harlem and Bronzeville. University of Chicago Press.
Hyra, D.S., 2012. Conceptualizing the new urban renewal: Comparing the past to the present. Urban Affairs Review, 48(4), pp.498-527.
Hyra, D., 2015. The back-to-the-city movement: Neighbourhood redevelopment and processes of political and cultural displacement. Urban Studies, 52(10), pp.1753-1773.
Hyra, D., 2016. Commentary: Causes and consequences of gentrification and the future of equitable development policy. Cityscape, 18(3), pp.169-178.
Jackson, K.T., 1987. Crabgrass frontier: The suburbanization of the United States. Oxford University Press.
Karas, D., 2015. Highway to inequity: The disparate impact of the interstate highway system on poor and minority communities in American cities. New Visions for Public Affairs, 7, pp.9-21.
Kreager, D.A., Lyons, C.J. and Hays, Z.R., 2011. Urban revitalization and Seattle crime, 1982–2000. Social Problems, 58(4), pp.615-639.
Massey, D.S. and Tannen, J., 2018. Suburbanization and segregation in the United States: 1970–2010. Ethnic and Racial Studies, 41(9), pp.1594-1611.
Marcuse, P., 1986. The beginnings of public housing in New York. Journal of Urban History, 12(4), pp.353-390.
Lee, B.A. and Wood, P.B., 1991. Is neighborhood racial succession place-specific?. Demography, 28(1), pp.21-40.
Marcuse, P., (1986) Abandonment, Gentrification and Displacement: the Linkages in New York City, in Smith, N. and Williams, P. (eds) Gentrification of the City, London: Unwin Hyman.
McKinnish, T., Walsh, R. and White, T.K., 2010. Who gentrifies low-income neighborhoods?. Journal of urban economics, 67(2), pp.180-193.
Meltzer, R., 2016. Gentrification and small business: Threat or opportunity?. Cityscape, 18(3), pp.57-86.
Mohl, R.A., 2004. Stop the road: Freeway revolts in American cities. Journal of Urban History, 30(5), pp.674-706.
Newman, K. and Wyly, E.K., 2006. Gentrification and displacement revisited. Research Bulletin.
Owens, A., 2012. Neighborhoods on the rise: A typology of neighborhoods experiencing socioeconomic ascent. City & Community, 11(4), pp.345-369.
Papachristos, A.V., Smith, C.M., Scherer, M.L. and Fugiero, M.A., 2011. More coffee, less crime? The relationship between gentrification and neighborhood crime rates in Chicago, 1991 to 2005. City & Community, 10(3), pp.215-240.
Pattillo, M., 2017. Black on the block. In Racial Structure and Radical Politics in the African Diaspora (pp. 21-52). Routledge.
Richardson, J, Mitchell, B., West, N., 2015. Home mortgage and small business lending in Baltimore and surrounding areas, NCRC https://ncrc.org/wp-content/uploads/2015/11/ncrc_baltimore_lending_analysis_web.pdf
____________________________, 2016. Home mortgage lending in St. Louis, Milwaukee, Minneapolis and surrounding areas, NCRC https://ncrc.org/wp-content/uploads/2018/01/Home-Mortgage-Lending2.pdf
Rothstein, R., 2017. The color of law: A forgotten history of how our government segregated America. Liveright Publishing.
Smith, N., 1979. Toward a theory of gentrification a back to the city movement by capital, not people. Journal of the American Planning Association, 45(4), pp.538-548.
Tach, L.M., 2014. Diversity, inequality, and microsegregation: Dynamics of inclusion and exclusion in a racially and economically diverse community. Cityscape, 16(3), pp.13-46.
Tissot, S., 2011. Of dogs and men: The making of spatial boundaries in a gentrifying neighborhood. City & Community, 10(3), pp.265-284.
Vale, L. and Gray, A., 2013. The displacement decathlon. Places Journal. https://placesjournal.org/article/the-displacement-decathlon/
Wyly, E.K. and Hammel, D.J., 2004. Gentrification, segregation, and discrimination in the American urban system. Environment and Planning A, 36(7), pp.1215-1241.
Zuk, M., Bierbaum, A.H., Chapple, K., Gorska, K., Loukaitou-Sideris, A., Ong, P. and Thomas, T., 2015, August. Gentrification, displacement and the role of public investment: a literature review. In Federal Reserve Bank of San Francisco (Vol. 79).
Zukin, S., 2010. Naked City: The Death and Life of Authentic Urban Places, New York. Oxford University Press
[1] Cultural displacement results when the tastes, norms, and desires of newcomers supplant and replace those of the incumbent residents, and can also entail the loss of historically and culturally significant institutions for a community.
[2] In this report we have used the words community, city, and metro area interchangeably. We have also used the census tract as a proxy for neighborhood in many cases and these words should be considered synonymous for our purposes.
[3] See NCRC report on HOLC and redlining https://ncrc.org/holc/
[4] https://www.chicagofed.org/publications/working-papers/2017/wp2017-12
[5] Arna Valley Apartments https://www.usatoday.com/story/news/nation/2014/11/10/northern-virginia-diversity-race/18079525/
[6] https://www.washingtoncitypaper.com/news/city-desk/article/21023685/after-150-years-lincoln-temple-united-church-of-christ-has-held-its-last-service
[7] https://s4.ad.brown.edu/projects/diversity/Researcher/Bridging.htm
[8] Data on the following racial and ethnic subgroups was used; non-Hispanic White, Black, Hispanic and Asian. Only the decennial Census offers a low enough sampling error to be of use, limiting our study to data from the 2000 and 2010 Censuses.
[9] The change in population at the census tract level is normally distributed.
[10] Hyra, D., 2015. The back-to-the-city movement: Neighbourhood redevelopment and processes of political and cultural displacement. Urban Studies, 52(10), pp.1753-1773.
Photo by Jami via Wikicommons.


