— Key Takeaways
- The number of banks and bank branches has declined significantly since 2009.
- Local branches are still crucial to small business lending.
- Small business lending is increasingly dominated by the largest lending institutions.
- Smaller institutions are disappearing as they merge or are bought out by larger banks.
- Lack of loan data makes it all but impossible to calculate the impact on small businesses from the loss of smaller banks.
- Regulators, lenders and the public will benefit from more loan data collected with full implementation of Section 1071 of the Dodd-Frank Act.
Executive Summary
The National Community Reinvestment Coalition (NCRC) analyzed the relationship between large banks that make small business loans and the number of branches those banks operate in each county in the United States. We found that the number of bank branches belonging to large banks and the gross domestic product (GDP) of a county are the two most important factors in the amount of small business lending in that county. Each year, a single branch location generated small business lending of nearly $3.03 million in metro areas, $2.3 million in smaller cities and $1.9 million in rural areas after accounting for other economic factors in our models. We also observed that between 2012 and 2018 the small business lending market has been increasingly dominated by the largest lending institutions. While bank branches across the country have continued their decline from peak levels in 2009, branch closures are less likely in communities where large banks make small business loans. Unfortunately, the lack of data from small and intermediate banks with asset sizes up to around $1.25 billion makes it difficult to assess the extent of their small business lending. This makes it critically important to implement marketwide small business loan transparency requirements under Section 1071 of the Dodd-Frank Act. We know that the number of small banks in operation declined dramatically during the study period, likely reducing an important source of small business lending. This may mean that among banks that make small business loans the market is going to be dominated by larger banks, with consequences for smaller businesses that may find building a relationship with large banks difficult.
— Key FINDINGS
- Since 2009, the number of banks in operation declined by 22% and the number of branches that serve the public fell by 14%.
- Most of the banks that closed were smaller and intermediate sized banks, with assets under about $1.25 billion.
- Business lending by large banks in urban areas is concentrated in counties where they have a branch, with an average $2.5 million in business lending per year per branch.
- The most important predictors of the amount of small business lending by large banks in metropolitan areas are the number of branch locations and county level GDP.
- In addition to the number of bank branches and GDP, the level of population and low levels of unemployment are also important predictors in micropolitan and rural areas.
- The number of bank branches continued to decline. Our prior studies have tracked this trend since 2009.
- The number of institutions declined unevenly across different assets sizes. The ranks of banks with largest assets size have grown, while small and intermediate size banks plummeted. In 2012, there were only 19 banks with assets of $100 billion or more, increasing to 30 by 2018. Meanwhile, small bank branches declined from 5,018 to 3,443 by 2018.
- While the amount of small business lending by banks with branch locations in a county was steady, an increasing portion of lending comes from outside banks and from business credit card lenders with their combined share rising from 25% in 2012 to 37% by 2018.
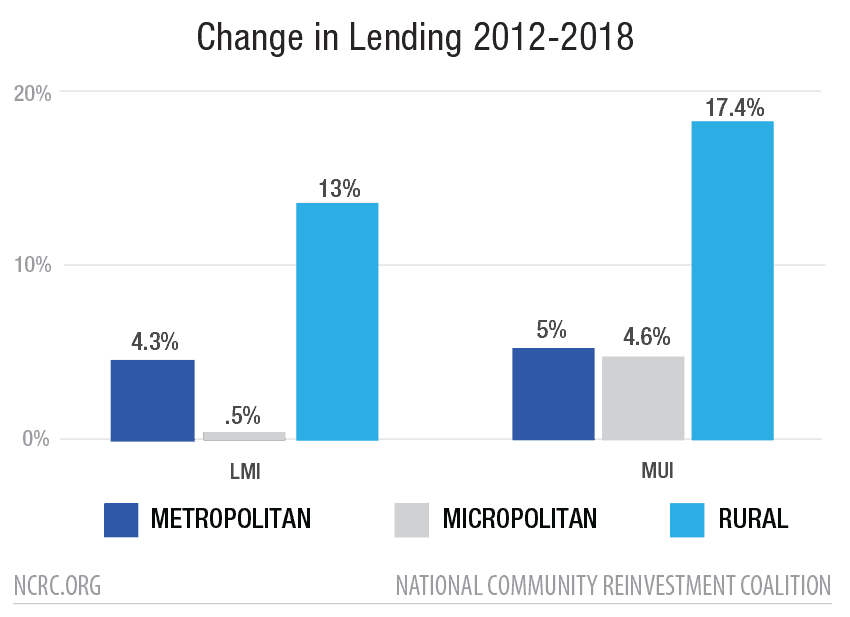
- Lending in low- to moderate-income (LMI) neighborhoods of metropolitan counties appears robust, however, lending to LMI areas in rural counties is only 10% that of lending in middle- to upper-income (MUI) areas. This could indicate a problem in loan access for rural business development.
Smaller banks (with assets under about $1.25 billion) are exempt from reporting on their lending under CRA. This makes it all but impossible to calculate the impact of the loss of these institutions on small businesses. There are indications that the steady decline in the number of smaller institutions and their branch locations are hindering financial access and disrupting relationship lending.
Bruce C. Mitchell, PhD, Senior Research Analyst
Jason Richardson, Director, Research & Evaluation
Zo Amani, CRA Coordinator
Introduction
Access to bank branches matters for small businesses. Small businesses rely on nearby bank branch locations for the cash and deposit services necessary for their day-to-day transactions, payroll services for their employees, cash management services, as well as for borrowing through lines of credit, term loans, equipment leasing, Small Business Administration (SBA) loans and credit cards. All these services are crucial to small businesses, especially in times of crisis. The most important small business assistance program launched in response to the COVID-19 pandemic was the Paycheck Protection Program (PPP), which provided essential loans to businesses which could be converted to grants. Businesses without a banking relationship were often excluded from access to the program.[1] A banking relationship creates a history of financial exchanges between banks and their customers. These exchanges give banks access to “soft information” about their business customer’s credit-worthiness. In fact, banks are far more dependent on the use of “soft information” about business customers when making decisions about credit-worthiness than they are for home loans because of the extensive use of individual credit scores in mortgage lending.[2] Personal knowledge of the business, its operations and its owners are key aspects of building a relationship.
Access to bank branches matter for businesses, because business banking relationships matter.
If banking and business relationships are so important, then what happens in a place when banks close their branches? There has been a large reduction in the number of branches since 2009. That year there were 4,719 bank holding companies with 95,596 brick and mortar full service branches or retail locations. As of June 30, 2020, this declined to 3,662 bank holding companies and 82,086 branch locations.[3] This is a 22% reduction in the number of holding companies and a 14% reduction in branch locations. Some researchers have found that the decline in institutions and loss in branch locations is related to an increase in the share of the underbanked and unbanked populations.[4] There are also indications that bank branch closures result in lasting declines in lending to small firms.[5]
In order to study the relationship between bank branches and small business lending, we used data collected on large asset-size banks[6] under the Community Reinvestment Act (CRA) to compare changes in the number of branches and levels of lending from 2012 to 2018. The beginning year of our study, 2012, aligns with the start of the economic expansion after the worst impacts of the Great Recession receded, and 2018 is the latest year for which CRA small business lending data was available.
Our questions:
- Has the reduction of bank branch locations and decline in banking institutions evident in the overall financial services market also impacted large banks making small business loans?
- How local are bank/business relationships? Do small loans made to businesses correlate with branch locations operated by large lenders within their county?
- Do year-over-year fluctuations in the number of branches maintained by large banks correlate with changes in small business lending activity when controlling for county-level economic activity like changes in GDP, unemployment, business density and population size?
- Do these relationships differ in urban, small town and rural areas?
- How dependent are LMI and MUI neighborhoods on lending by large banks? Has the volume and amount of small business lending in LMI areas been as robust as it has been for MUI areas?
Literature
A review of small business lending research in banking and finance literature showed that researchers face the same data limitations that constrain policymakers. This fact alone should encourage the Consumer Financial Protection Bureau (CFPB) to expeditiously implement Section 1071 of the Dodd-Frank Act. The lack of a comprehensive small business lending dataset limits research that could inform tailored public policy recommendations to better support small businesses, especially businesses owned by people of color and women-owned firms. The literature review revealed the relevant scholarship on small business lending from the last 10 years and demonstrated the need for future research to investigate the effects of bank branch closures on small business lending. First, this review suggested that small business underwriting data is limited for research and public scrutiny. Second, the review showed that relationship lending is important because firm creditworthiness via qualitative information can be difficult to ascertain with current lending technologies. In addition, relationship lending is mostly a function of staff working in local branches. This is crucial for businesses in LMI neighborhoods that are the target of assistance under the CRA. The LMI qualification means that the census tract in which a business operates has a median family income below 80% that of its surrounding metropolitan area, or state. Businesses in LMI areas and businesses of color benefit from relationship lending because of the reliance by banks on “soft information” in making lending decisions. Finally, the review provided evidence on the effects of bank branch closures and suggested that when branches close, mortgage lending may continue while small business lending declines.
The lack of a comprehensive small business lending dataset limits research.
Innovations in lending technologies have made it easier for banks to collect information from prospective borrowers. Berger and Black provided an extensive literature review on lending technologies which were defined as the “primary information source or system used in the underwriting process which includes screening and underwriting policies and procedures, a loan contract structure, and monitoring strategies and mechanisms.”[7] They identify 11 lending technologies that are employed by banks and other financial institutions for small business lending decisions. In comparison to mortgage lending, small business lending relies more on soft-information or qualitative information that is not easily obtainable with information technology systems.[8] Thus, relationship lending that facilitates interpersonal exchanges of soft-information are often employed to address the lack of data on the creditworthiness of small businesses.[9] However, most small business lending consists of a mix of hard-information and soft-information.[10] This need to obtain more qualitative information is the primary reason why small business lending has been costly, especially as the physical distance between banks and firms has grown over the last 20 years.
Mortgage lending has nuanced effects on small business lending. For example, Bezemer et al. used international bank allocation credit data from 1990-2016 from 74 countries to explore the shift in bank credit away from traditional business lending since the 1990s. Their findings suggest that “increases in mortgage lending flows in advanced economies raise business credit flows in the short run, but crowd out business credit in the medium run.”[11] A study of differential impacts of branch closures on lending by Nguyen found that bank branch closures had a prolonged negative impact on small business lending but short-term effects on local mortgage lending.[12] Nguyen found that bank branch closings had a substantial impact on local business lending. It takes time for lenders to learn about a business and get information on the specific details of the business that potentially impact their credit decision. This is why relationships are important in business lending, and when those relationships are disrupted it can take years to replace.[13]Also, these findings imply that low-income borrowers and borrowers of color who have a limited credit or business operation history and depend to a greater extent on relationship lending could have more challenges acquiring small business credit. This information asymmetry creates the opportunity for disparate impact. Decisions by banks to maintain or close branches based on sound business decisions can have an unforeseen impact on lower-income consumers and people of color. Xuy found that branch closures do not affect mortgage lending but reduced the amount of small business lending by about 22% in total volume, including in areas with alternate local bank branches.[14]
Declines in Small & Community Banks on Branches
Community banks were once a cornerstone of financial intermediation and provided the majority of small business loans in the U.S. However, their share of assets and of the lending market fell from 40% in 1994 to 20% in 2015.[15] Small banks or community banks are more likely to engage in relationship lending with small businesses than larger banks with dispersed bank branches.[16] In addition, small banks tend to have a comparative advantage in lending to small businesses, and large banks are more inclined to lend to older and more established small businesses.[17] The Government Accountability Office (GAO) synthesized data from the Federal Deposit Insurance Corporation (FDIC) to find that about 20% of total lending by community banks can be characterized as small business lending compared to about 5% by larger banks.[18] The number of small banks has declined in the past 20 years while large banks have increased in number and size.[19]
Community banks are more likely to engage in relationship lending with small businesses than larger banks with dispersed bank branches, but their market share fell from 40% in 1994 to 20% in 2015.
According to the FDIC, from 1985 to 2010, the decline in FDIC-insured institutions has mostly come from banks with assets under $100 million.[20] In 2010, community banks represented 92% of all FDIC-insured institutions and 95% of all U.S. bank organizations, and held a majority of banking deposits in U.S. rural and micropolitan counties.[21] The FDIC’s community bank definition includes five components and the most visible component is asset size. Most of the community banks defined by the FDIC’s approach have total assets of less than $1 billion dollars. Community banks are considered to be community-centered because they focus on the financial service needs of households and firms surrounding their main offices and branches in specific cities and counties where they maintain the majority of their bank operations.[22]
The steady decline in community banks has become a growing concern because it could lead to lower lending across various sectors in the economy, especially for small businesses.[23] Other factors such as bank market concentration and bank merger and acquisition activity affect bank profitability and small business lending. Amel and Prager examined the association between several bank and market characteristics on community bank performance from 1992 – 2011, and found that community bank profitability is affected by market characteristics such as per capita income, unemployment rate and share of market deposits held by other community banks.[24] Scholars have found that bank market concentration and structure affect small business lending in both lending quantity and price.[25]
Bank Branches and Small Business
Bank branch networks are a critical part of the financial services system. Branch networks are important because they allow banks to increase the flow of credit to locations with less deposits and to where credit may be in greater demand.[26] After the 2007-2008 financial crisis, bank branch expansion declined due to greater bank consolidation and competition, higher regulatory costs and persistent low-interest rates driven by accommodative monetary policy.[27] Bank branch locations have declined about 10% from 2008 to 2017, and this decline probably affects small businesses that rely largely on local-level bank relationships or in other words relationship-based small business lending.[28]
There was a 7% decline in the number of bank branches in urban and rural counties from 2012 – 2017.
A few studies have looked at the varying urban/rural geography of bank branch closures, and how this has differing impacts on small businesses. According to the Federal Reserve, there was a 7% decline in the number of bank branches in urban and rural counties from 2012 – 2017. However, the impact was especially damaging in counties with higher levels of poverty and where residents had lower socioeconomic status.[29] Rauterkus and Munchus showed that small businesses in rural communities have greater difficulty securing small business loans.[30] NCRC research conducted for the Appalachian Regional Commission found that in 2003 banks were more likely to lend to small businesses when they had more branches on a county level.[31] Subsequent data analysis confirmed these findings and showed that a higher number of branches is associated with a higher number of small business loans on a county level in Appalachia.[32] Essentially, the credit market for small business lending continues to be local and small business lending is typically more relationship-based than mortgage lending, therefore, bank branch declines could have adverse effects on small business lending.[33] Beyond the aforementioned research, inquiries that investigate the direct effects of bank branch closures on the provision of small business credit is limited.
Prior Research Methods
There are a few studies that employ methods controlling for economic factors which are similar to our proposed research design. Sengupta and Dice constructed a regression model that estimated the effects of county demographics, economic considerations and bank competitive factors on bank branches.[34] Their results suggested that local factors are important determinants of bank branching, and local market competition has had larger effects on branch openings and closings since the 2007-2008 financial crisis. Nguyen used a standard regression method in her empirical framework to measure the effects of branch closings on local lending.[35] Her findings suggest that bank branch closures limit small business lending and forms of relationship-based lending. Calzada et al. leveraged two FDIC datasets with census data to investigate several factors that affect the presence of bank branch locations in various geographical areas of the country, prior to and after the 2007-2009 recession.[36] They used a regression model that investigates market factors such as county median income, unemployment, business density and county type on bank branch density. They found that mergers affect bank branch density, and merger activity had positive effects (i.e., increased bank branches) in metropolitan counties, mixed effects in micropolitan counties and negative effects (i.e., decreased bank branches) in rural counties.
We modified their regression models to determine small business lending outcomes related to the geographical location and decline of bank branches at the county level from 2012 – 2018. A preliminary review of data from the Federal Financial Institutions Examinations Council (FFIEC) CRA Disclosure D1-1 file shows that bank branch locations that offer small business loans have not declined as much as the total number of branch locations nationwide. In this paper, we focused on large financial institutions that engage in small business lending reporting under guidelines established by CRA. We examined how their bank branch locations (e.g. brick and mortar full-service branches) affect small business lending. In addition, we investigated the variations of these effects by county level; and assessed the impact of bank branch declines on small business lending in LMI and MUI census tracts across metropolitan, micropolitan and rural geographies.
Methods
This report is a national examination of branch closures and CRA reported small business lending at the county level. Data from federal sources for the period 2012-2018 was gathered. The primary data is derived from the FDIC annual summary of deposits reporting at the branch level.[37] This dataset includes the address, deposits and holding corporation information for all FDIC insured depository institutions, but not credit unions, which are excluded from the scope of this report. Small business lending data as reported for purposes of CRA and maintained by the Federal Financial Institutions Examination Council (FFIEC) is utilized to assess the volume and amount of business lending by large financial institutions classified by their asset size.[38] The yearly asset-size thresholds were utilized to stratify the list of banking institutions into “small” and “large.”[39] Large banks were then grouped into four asset-size categories corresponding to the Federal Reserve classifications:[40]
Community Banks = Yearly FFIEC CRA large bank threshold to $10 billion
Smaller Regional Banks = Over $10 billion to $50 billion
Large Regional and National Banks = Over $50 billion to $100 billion
Very Large National Banks = Over $100 billion
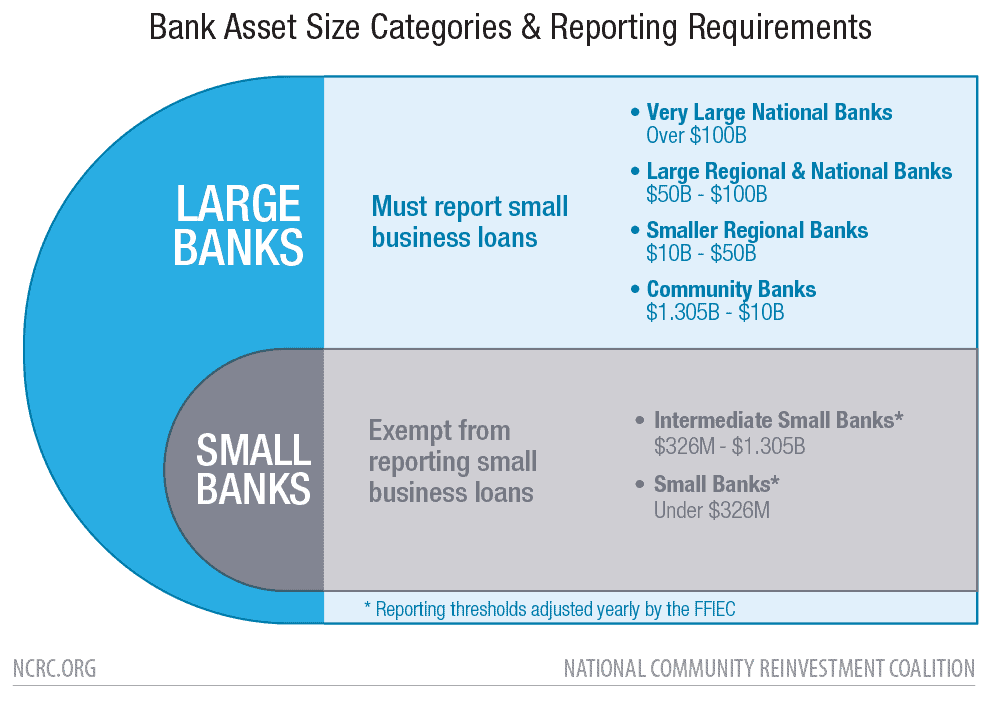
Unfortunately, the data does not contain comprehensive information on lending by small or intermediate-small banks. Nor does it contain data on loans made for more than $1 million. Banking institutions in those asset size categories report their business lending on a voluntary basis, preventing a comprehensive analysis of their impact on markets. However, the FFIEC CRA data captured 88.5% of the number and 69.2% of the amount of small-dollar loans made to businesses by depositories between 2012 and 2018.[41] This is a substantial portion of the business lending activity of banks, and provides a basis for an analysis of large institution small-dollar business lending.
Ancillary data on county level GDP was taken from the U.S. Bureau of Economic Analysis (BEA),[42] while totals of operating businesses were derived from the U.S. Postal Service (USPS) and Dept. of Housing and Urban Development (HUD) administrative data on address vacancies.[43] The source of county level annual average unemployment data is the U.S. Bureau of Labor Statistics (BLS).[44] Classifications of counties as metropolitan, micropolitan and rural were taken from the 2013 U.S. Dept. of Agriculture Economic Research Service rural-urban continuum codes (RUCC), which classify counties by their population and proximity to major metropolitan areas.[45]
Data on banks making business loans was acquired from the FFIEC disclosure data utilizing table D1-1, and the matching transmittal sheets. All loans less than $1 million were totalled for each large lender at the county level and adjusted for inflation.[46] Bank branch location data was selected based on the county location and linked to the small business data using the RSSD identification number. Three classifications of bank branch locations were made:
- Branches in county – Banks making small business loans that had at least one branch location within the county. These were identified by matching the RSSD number from the D1-1 table and the FDIC Summary of Deposits file.
- Credit card lenders – Banks with very limited branch networks, but large numbers of loans at low dollar averages (below $15,000 average).
- Branches out of county – Banks making small business loans in a county without a branch located there. In these cases, there was not a match in RSSD between the D1-1 table and FDIC Summary of Deposits file.
Banks were then classified by asset size, with lending by small banks excluded due to their exemption from reporting, and large banks stratified. Counties were divided into metropolitan, micropolitan and rural categories utilizing their rural urban continuum code. Lending itself was also classified as being made to LMI or MUI census tracts using classifications from the FFIEC CRA small business lending D1-1 table.
Conventional statistical techniques were used to evaluate the data. Descriptive statistics and Pearson’s correlation coefficient were used to assess relationships between the dependent variables of the number and amount of small businesses lending and bank branches, and predictor variables of GDP, unemployment rate, business density and rural to urban location (indicated by population size). A multivariate regression model was used to assess the relationship of small business lending and branching as a predictor variable along with the other predictor variables. This equation was adapted from the one utilized in the work of Calzada et al. that modelled bank branch density at the county level. Our equation substitutes the number and amount of small business loans for bank branch density as the dependent variable and is expressed as:
Total SB lending (amount or number) = B0 + B1 #Branches + B2 GDP$ + B3 %Unemployment % + B4 Business/Residential Density + B5 Rural/Urban Continuum Code + B6 Year + B7 County + E
This model is designed to describe the relationship between small business lending and branching while controlling for a broad range of economic factors at the county level, including size of the economy through GDP, relative economic prosperity through unemployment, the level of urban development and the density of businesses relative to population over time. Calzada’s research found that this model was useful for predicting the impact of changes in branches on financial exclusion at the county level in the U.S.
The lack of a comprehensive small business lending dataset limits research.
Results & Discussion
Reduction in branch locations and banking institutions
1) Has the reduction of bank branch locations and decline in the number of banking institutions evident in the overall financial services market also impacted large banks making small business loans?
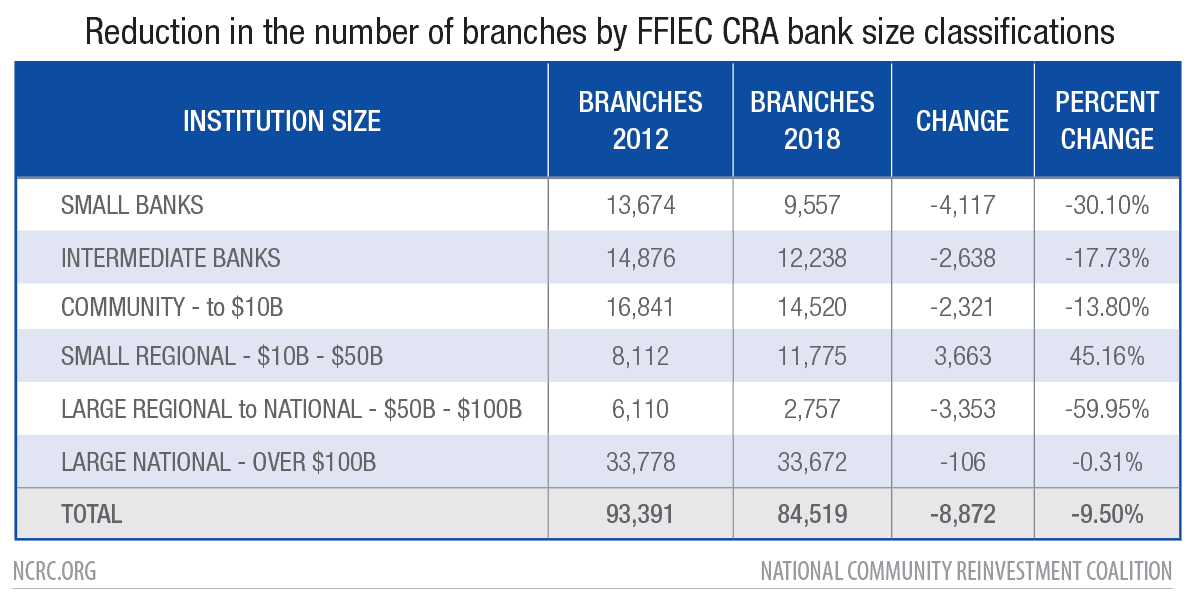
During the period 2012-2018, the number of brick and mortar and retail locations in the 50 states and District of Columbia went from 93,391 to 84,519, a 9.5% decrease (Table 1). These results closely matched those of a 2019 Federal Reserve study covering 2012-2017, which found that there was a 7% loss in branches, which had the most impact on rural areas because of their already low number of branch locations.[47] Our findings indicated that the decrease in the number of branch locations was especially pronounced for small and intermediate-small sized banks (those with assets below the FFIEC asset-size thresholds for large banks). Most of the large bank categories also closed a high percentage of their branches, particularly those with asset sizes ranging between $50 billion and $100 billion. The only bank size category which saw branch locations increase were small regional banks ranging between $10 billion and $50 billion in assets. Banks categorized in that class saw their branch networks increase 45%, generally as a result of mergers with other institutions.
The overall number of banking institutions declined by 23.4%, from 7,250 in 2012 to 5,551 by 2018. Figure 1 shows how declines in the market varied by bank asset size. Small institutions declined over 31%, from 5,018 to 3,443 (Table 2). Meanwhile, the largest banks with assets over $100 billion increased from 19 to 30 institutions. Ten of the 16 large regional or national banks grew to large national banks, and seven of the small regional banks became large regional or national banks. Only four large regional or national banks did not grow, remaining in the same asset-size class from 2012 to 2018.
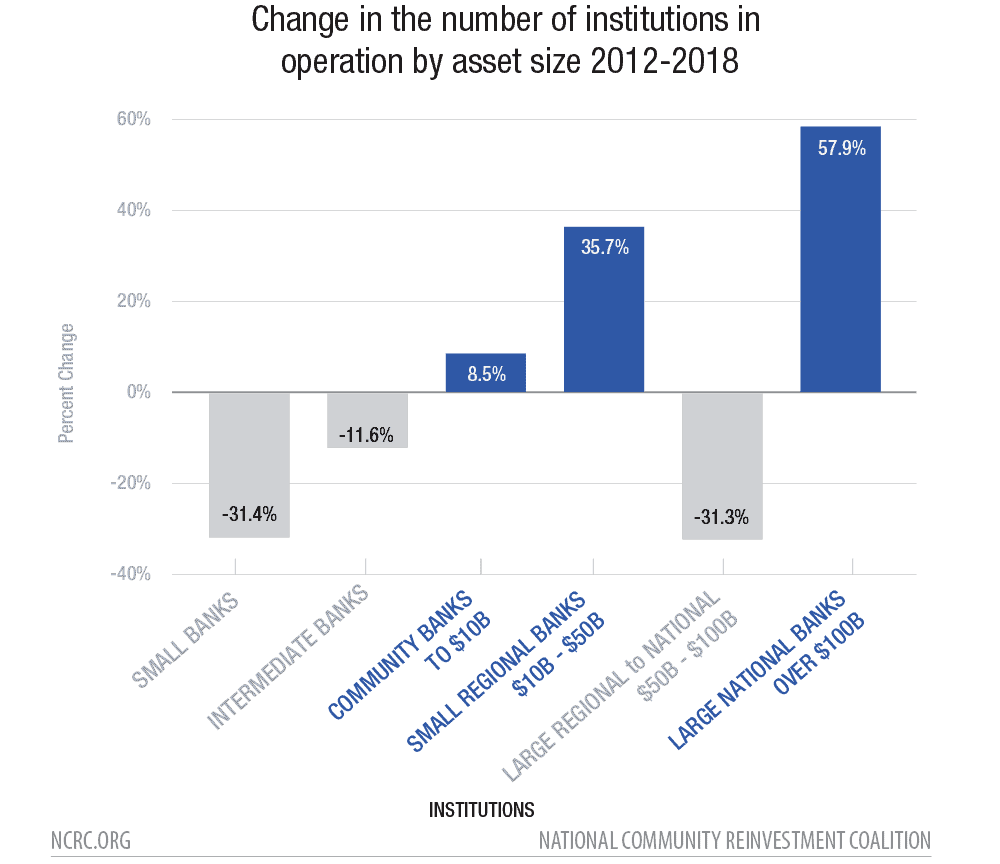
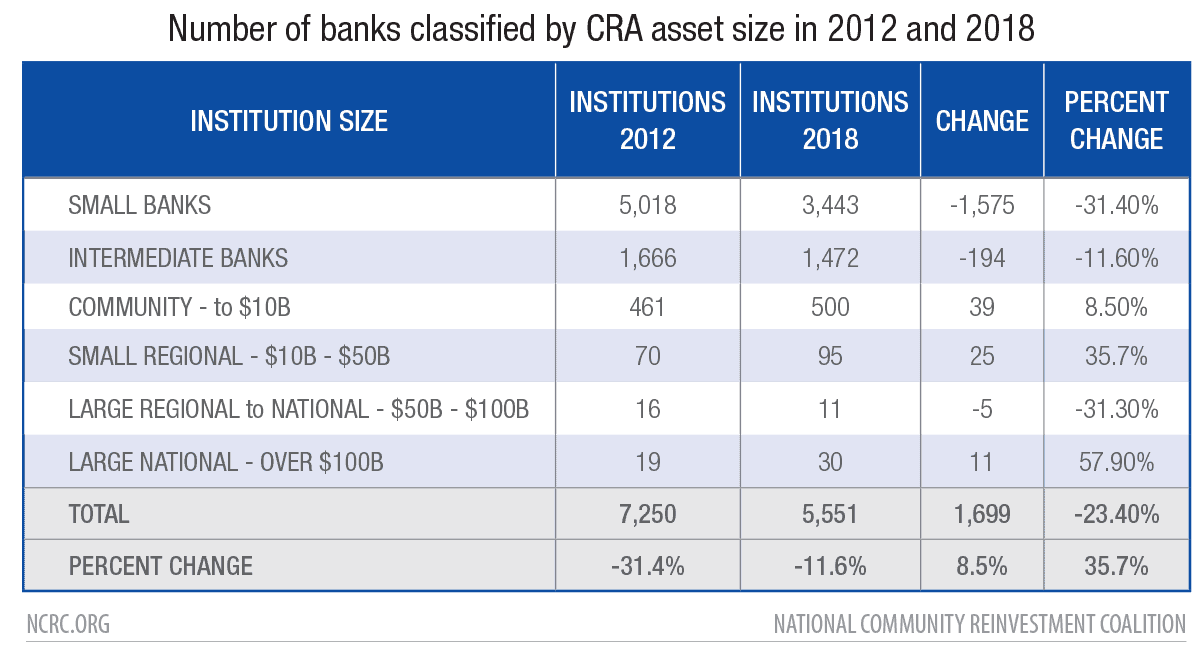
The decline in the number of institutions whose assets qualify them as small banks indicates the severity of closures and consolidations in this segment of the market. In his testimony before the House Committee on Financial Services in September 2020, Federal Reserve Chairman Jerome H. Powell noted that there has been a 30 year trend in small bank closures and consolidations, and expressed his concern that the COVID-19 pandemic makes them particularly vulnerable due to declines in small business and real estate lending.[48] Meanwhile, large banking institutions with over $1.252 billion in assets grew from 566 to 636, a 12% increase, with the largest banks of over $100 billion in assets increasing their number by 57.9%. Despite the overall decreases in the number of institutions and bank branches, we cannot answer whether the number of small banks engaged in small business lending has declined, because small bank lending data is unavailable. However, the disproportionality of their representation in the number of closed locations – double that of large banks – indicates that this segment most likely was impacted.
Local relationships and small business lending
2) How local are bank/business relationships? Do small loans made to businesses correlate with branch locations operated by large lenders within their county?
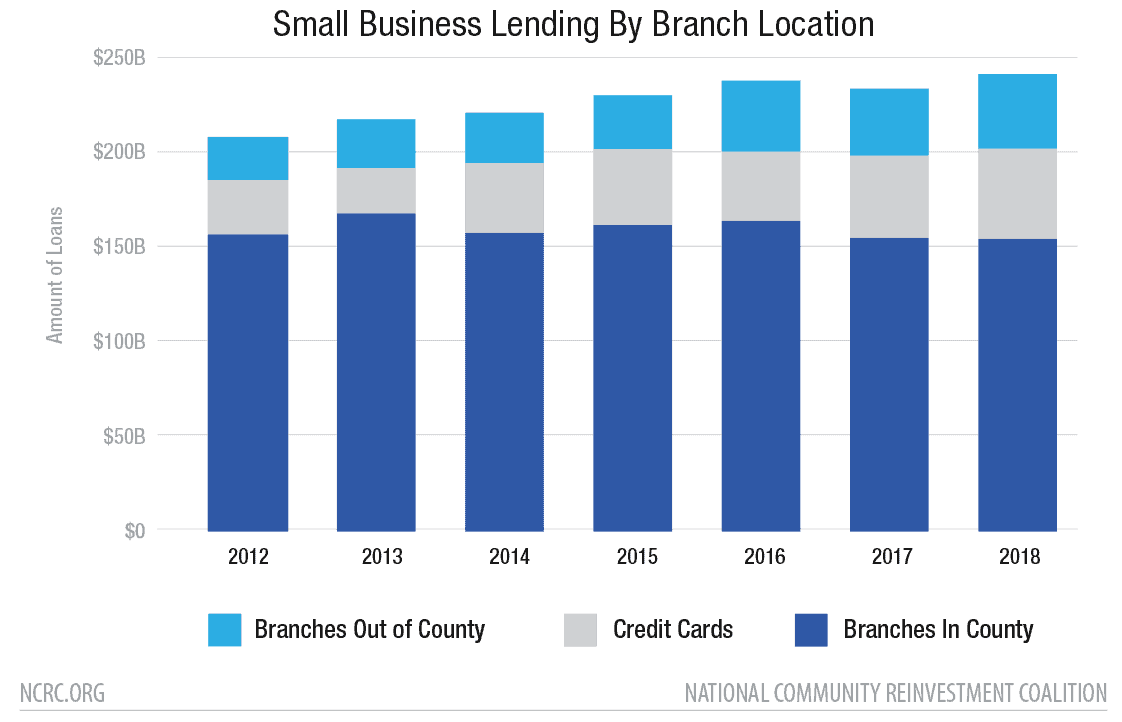
During the 2012 to 2018 period, the amount of small business loans made by lenders that had a branch located within the same county was quadruple the amount of credit card loans[49] or loans made by lenders with branches outside the county. The total amount of loans by lenders with branches in the county was over a trillion dollars, with about $257 billion in credit card and $218 billion in loans by outside lenders (Figure 2a). There appear to be changes in this dynamic, with Figure 2b showing year-over-year fluctuations with slight decreases by lenders with branches in the county (down 3.0%), but much larger gains in credit card lending (up 70.4%) and lending by banks with institutions outside the county (up 72.3%).
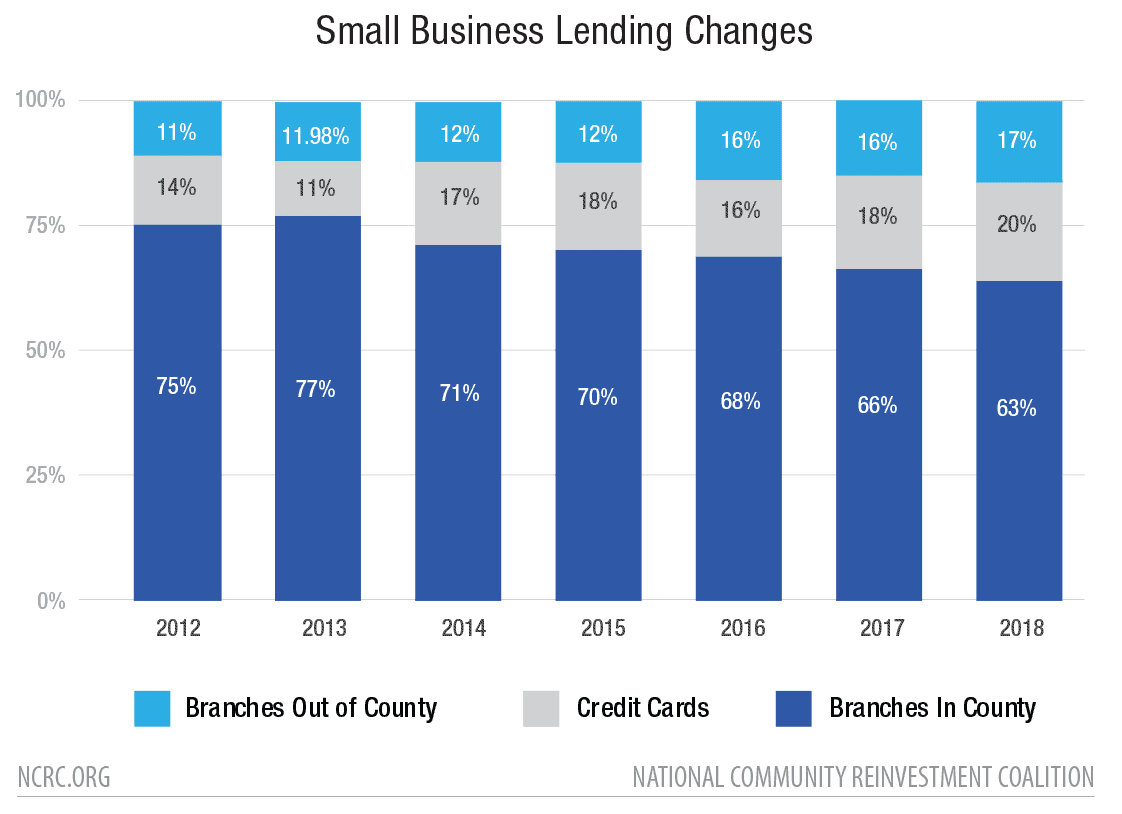
There were strong associations between the overall number of branches in a county and all small business lending, regardless of whether it be by banks with branches in county, out of county or credit card lending. The relationship was strongest for banks with branches in county (Pearson’s r = .967, p<.01). Banks with branches in the same county where their small business loans were made were responsible for two-thirds of the amount of loans and had the strongest statistical associations. However, their proportion of the market declined over time. In 2012, banks with branches in the county accounted for 75% of the reported lending, declining to 63% by 2018. While banks with a presence within their county remain the major source of lending, the market share taken by credit card lenders and banks located outside the county is growing. This might indicate that the small business lending market is changing in a way that is similar to the mortgage lending market. An increasing share of the mortgage lending market is going to nonbank lenders. A 2019 Federal Reserve study of small business lending and branching found that while a majority of small business owners preferred doing business with local banks, a growing percentage is shifting to on-line lenders. A continuation of this trend toward non-local lenders has implications for CRA assessment areas and evaluation criteria, emphasizing the importance of modernization efforts.
Changes in the number of branches, changes in small business lending
3) Do year-over-year fluctuations in the number of branches maintained by large banks correlate with changes in small business lending activity when controlling for county-level economic activity like changes in GDP, unemployment, business density and population size?
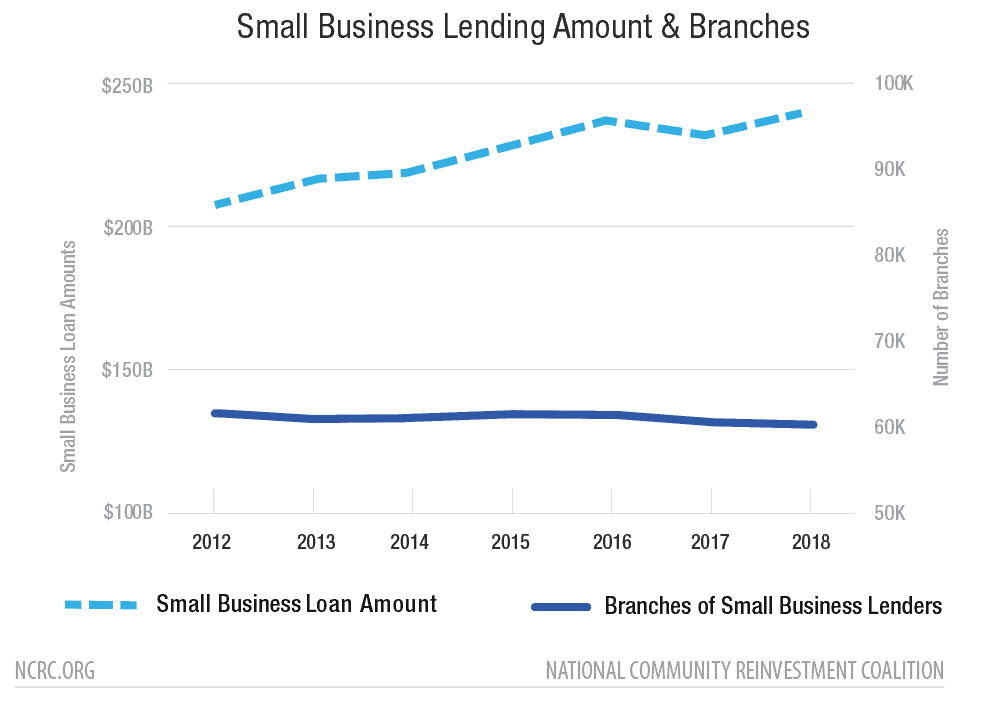
The strength of the association between the number of bank branches and the dollar amount of small business lending could be driven by a number of factors relating to the overall economy of an area. It is difficult to separate the influence of these factors on the amount of small business lending, confounding our ability to understand their importance. For instance, are counties with larger numbers of branches more densely urban and economically vibrant, with higher business density, GDP and lower rates of unemployment? In order to test those assumptions, we constructed a multivariate regression model for the number and amount of small business lending at the county level that controls for county-level economic factors. The multivariate model was based on a similar one utilized by Calzada, et al. to assess the relationship of bank consolidations and branch closures on financial access. First, we looked at the overall amount of small business lending by large banks, which grew from $208 billion in 2012, to nearly $240 billion by 2018, an increase of 15.3% (Figure 3). Meanwhile, the number of branches making small business loans declined from 64,608 to 61,994 (4.0%) and the number of large institutions making small business loans declined from 830 to 700 (15.7%).
After analyzing the growth in the amount of lending and loss of branches and institutions, we ran a multivariate analysis with the total amount of small business lending as the dependent variable (Table 3). The relationship between small business loan amounts and the variables are strongest for the combined all areas model followed by lenders with branches in the county. For banks with branches in the county, there was an increase of $3,143,710 in the amount of small business lending for each branch. These relationships were still statistically significant (p <.001) for credit card lenders and small business lenders with branches outside the county (p. <.001), though with smaller coefficients, meaning less lending for each additional bank. The coefficients can be interpreted that for every branch location, $2,475,640 in lending is generated by banks with branches in that county, $396,340 in credit card loans and $286,890 in loans by banks with branches outside the county. The models indicate that greater access to financial services through more branches is associated with greater small business lending regardless of whether the bank operates a bank in the county. However, banks that do operate branches in the county have a much higher lending coefficient, six times that of credit card lenders and nine times that of banks outside the county. This relationship between branches and greater business lending holds even when other economic factors like GDP, unemployment and urban development measured by population size are controlled for. Therefore, the number of branches has a significant positive relationship across models. This can be interpreted that counties with improved financial services access through branches have significantly higher amounts of small business lending in general.
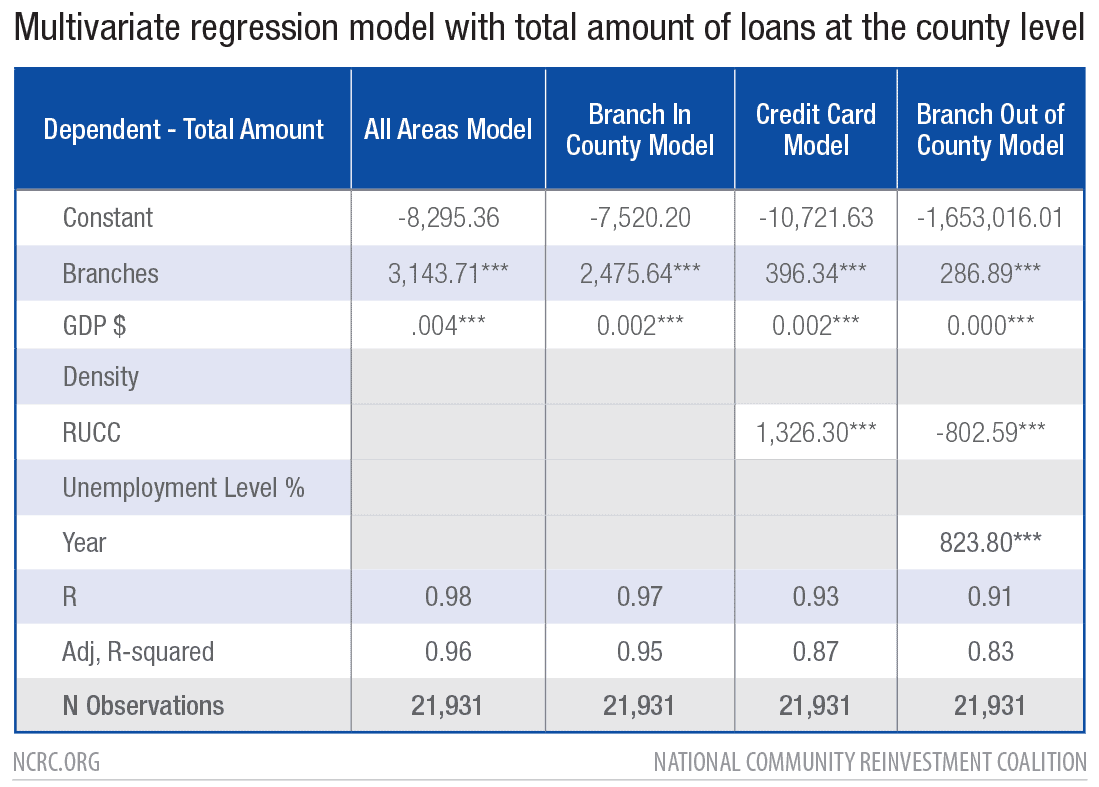
In the case of all four models, the number of branch locations and GDP are significant, but there are indications of collinearity between these variables. Larger metropolitan areas with high GDP have a higher number of branch locations per county, reflecting a robust economy and business lending market.
There are additional significant variables across all four models, which strengthened the models slightly. These variables included a positive relationship with the Rural to Urban Continuum Coefficient (indicating population size) in the case of credit card loans, which became negative for loans made by banks outside of the county. This indicated that greater urban development is associated with more credit card lending but increasingly, rural areas are more likely to rely on banks without branches in their county. Finally, the year of lending was significant in the case of loans made by banks without branches in the county, indicating the increased amount of small business lending made by outside banks, matching the data presented in Figure 2b. Unemployment was insignificant in all of the models. Overall, the amount of small business lending has increased despite a decreasing number of branch locations. However, the number of branches in a county remains the single most important determinant of greater lending when controlling for other economic factors, followed by the county’s GDP.
Small business lending in urban and rural areas
4) Do these relationships in small business lending and branches differ in urban, small town and rural areas?
Our findings indicated that the majority of small business lending (two-thirds of the total) was made by banks with branch locations in the county where the loans were made. But did these relationships differ in metropolitan, micropolitan and rural areas? To look at lending in different urban and rural counties, we used the U.S. Dept. of Agriculture Economic Research Service (USDA ERS) guidelines to define metropolitan, micropolitan and rural counties. Table 4 breaks out the lending by geography,,and indicates that the majority of loans were made by banks with branches in metropolitan areas. However, both the dollar amount of credit card loans and loans made by banks with branches outside the county steadily increased between 2012 and 2018 (Figures 4a-4c).
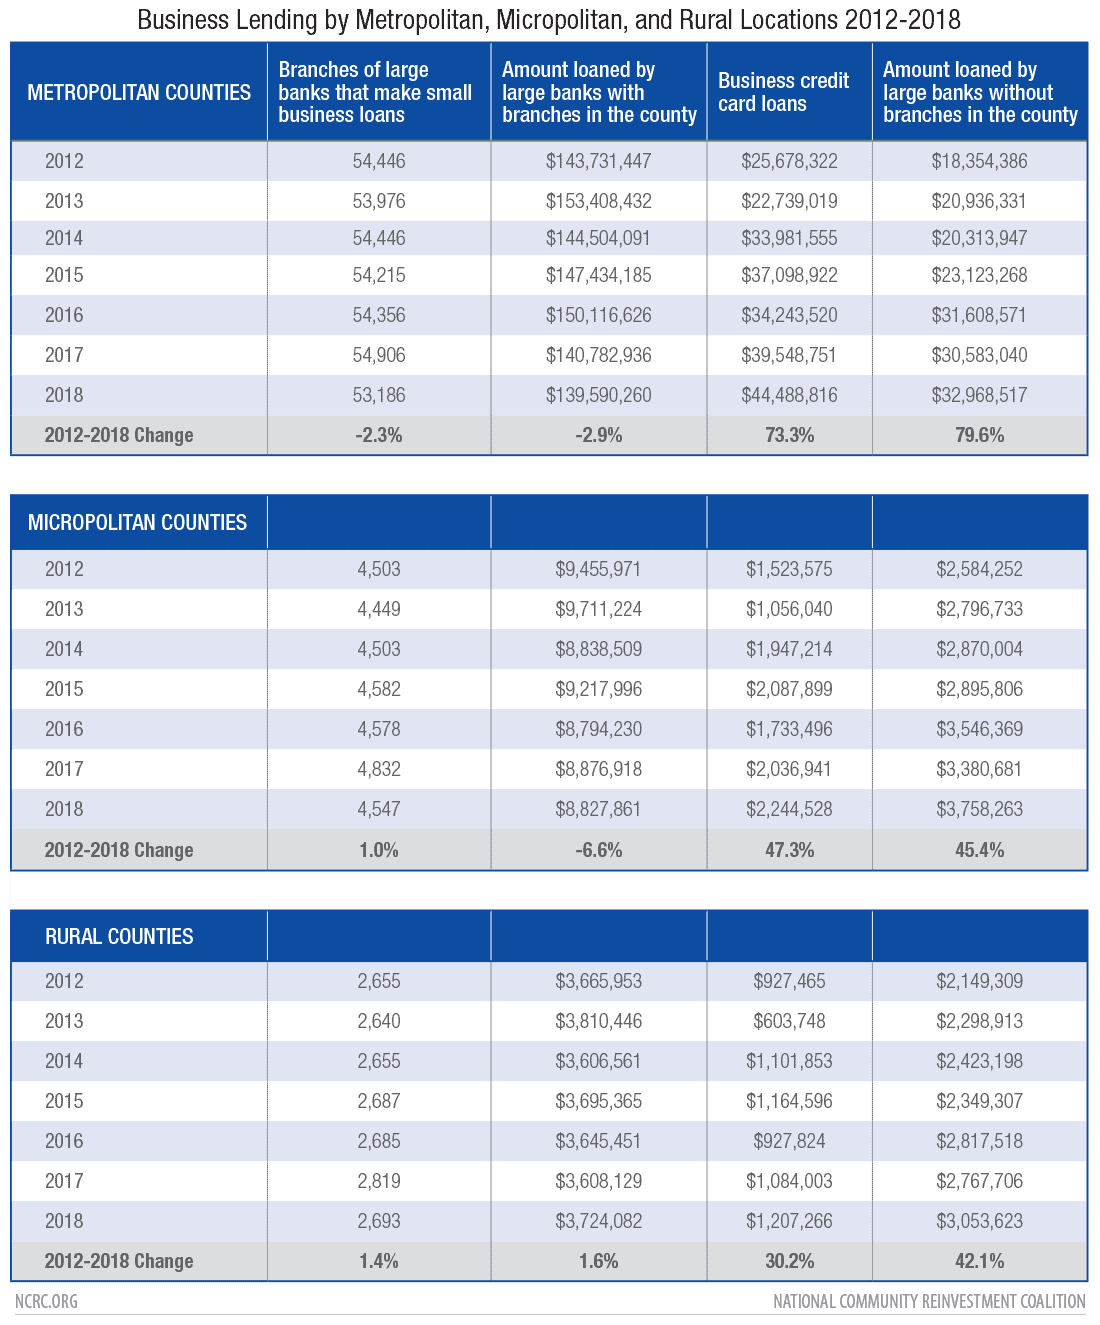
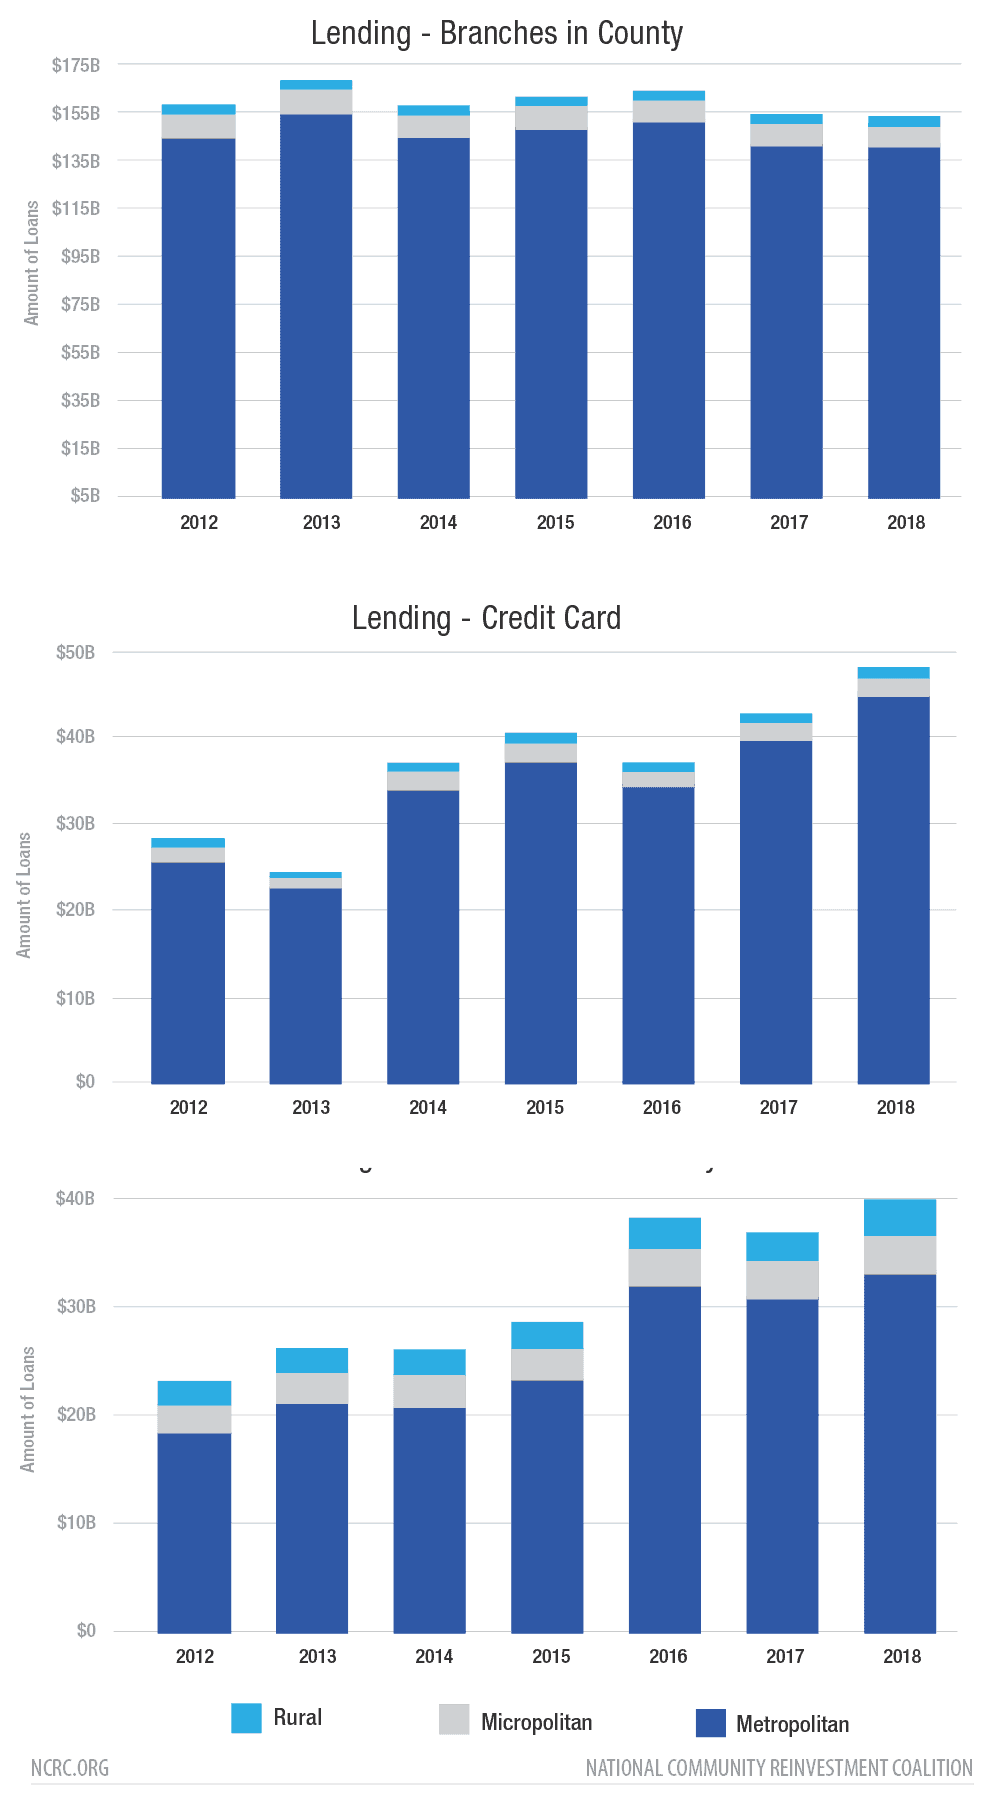
This growth was highest in metropolitan areas (up 62.5% for credit card loans and 77.9% for loans by banks with branches outside the county), but also up in micropolitan (up 27.5% and 44.8%, respectively) and rural areas (up 23.8% and 40.3%, respectively). Meanwhile, lending by banks with branches in the county increased 5.4% in metropolitan areas and only 1.7% in rural areas, but decreased 3.5% in micropolitan areas. While lending by banks with branches in counties was steady, there was a large increase in credit card use and reliance on non-local banks, especially in metropolitan areas.
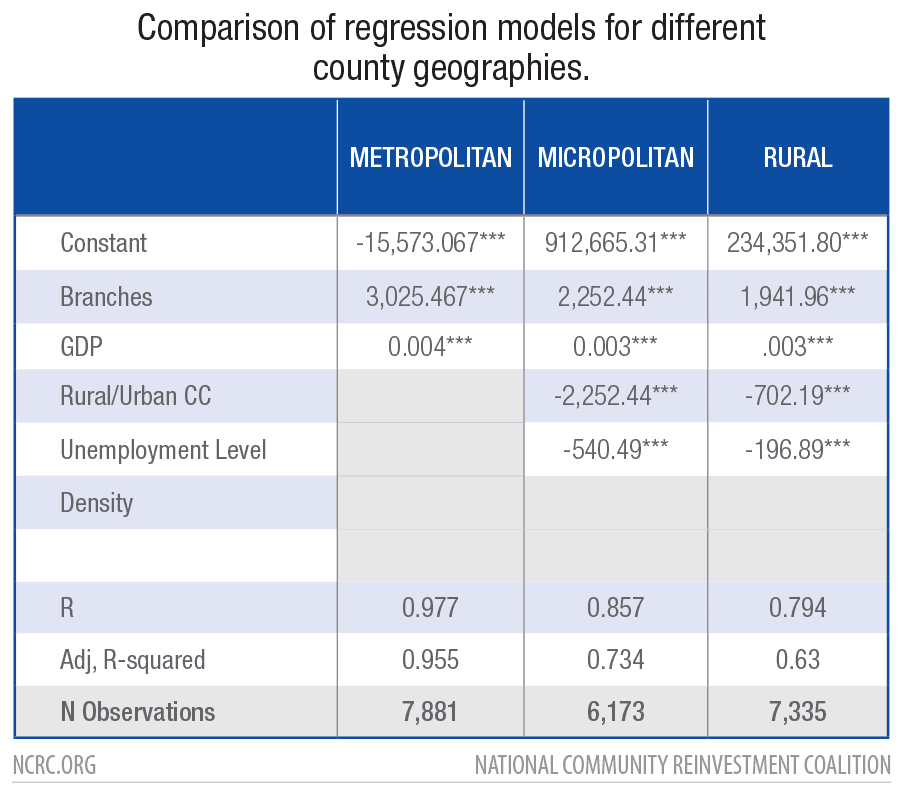
Since the greatest portion of small business lending dollars went to metropolitan areas, how might factors other than the number of branches in the county be associated with lending? We adapted our multivariate regression model to check for other economic drivers at the county level – levels of unemployment, business density, the degree of rurality and population size might have been important factors in micropolitan and rural areas. In metropolitan counties, only the number of branches and GDP added to the strength of the regression model and were significant. However, in micropolitan and rural counties the relative level of development, lower levels of unemployment also added to the strength of the model and became statistically significant factors (Table 5). However, the overall quality of the fit of the regression model for micropolitan and rural areas was not as good as that of the metropolitan model. The models declined from a high adjusted r-square of .955 in metropolitan areas to .734 and .630 in micropolitan and rural counties. This indicated that the strong relationship between the amount of lending, number of branches and size of GDP seen in metropolitan areas, was less of a factor for micropolitan and rural areas. Other factors, some of which were unidentified, become more important to the amount of lending in micropolitan and rural geographies. Additionally, the amount of lending per branch varied by geography, as indicated by the change in coefficient. In metropolitan areas, each branch generated $3,025,467 in lending. In micropolitan and rural areas, this fell to $2,252,440 and $1,941,960, respectively.
Small business lending to urban and rural LMI and MUI areas
5) How dependent are LMI and MUI neighborhoods on lending by large banks? Has the volume and amount of small business lending in LMI areas been as robust as it has been for MUI areas?
While there were increases in lending between 2012 and 2018, were these increases equally apportioned in LMI and MUI areas within counties? Figure 5 shows the difference in lending between banks in 2012 and 2018. Overall lending amounts increased by 4.3%, or almost 2 billion in LMI areas and 5.4%, or $7.2 billion in MUI areas during the period. The relative evenness of the increases fails to take into account the wide disparity in amounts, with lending in MUI areas, a gap of $87.6 billion in 2012, which widened further to $92.8 billion in 2018.
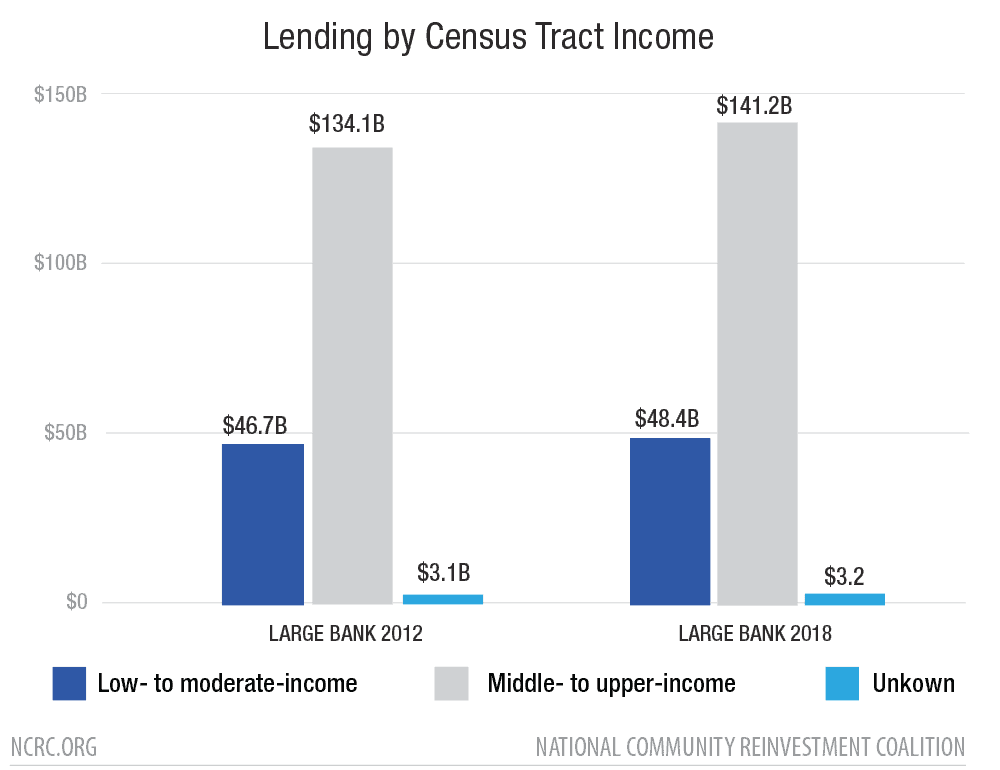
Increases in lending across LMI and MUI tracts were reflected across the different geographies. While rural areas saw the greatest increases, the increases in rural LMI were 5% lower. Lending in LMI tracts of micropolitan areas increased only slightly, and was 4% lower than in MUI tracts. Finally, lending in LMI and MUI tracts of metropolitan areas differed by less than 1%.
Future Trends – COVID-19 and the automation of small business lending
The onset of the COVID-19 pandemic wrought changes across most industries, and is accelerating existing trends towards fewer direct interpersonal interactions in delivery of services (e-commerce)[50] and greater automation in risk management[51] and underwriting.[52] Already, mortgage origination and processing has seen dramatic shifts, from fully desktop to remote appraisals and to the use of technology that allows the remote processing of loan paperwork. Fannie Mae modified the instructions for lenders to clarify these changes in appraisals. The impact on small business lending is not as certain. Typically, small business lending has not relied on credit scores to the extent that mortgage lending has, and instead has been more relational as this study bears out. The large banks have had much greater lending in areas where they had a branch presence, for example. But the increasing share of lending made by credit card banks and large banks with no branches in the county suggest this may be changing. The literature on small business lending indicates that businesses owned by minorities or women suffer from information asymmetry, or an inadequate pool of information by which to make credit risk assessments, which greater automation could alleviate. If COVID-19 drives an acceleration of automation in small business lending, credit card lenders or non-local banks could be positioned to capitalize on this trend. This could further weaken the association of branches and small business lending.
Conclusion
Our results highlight the importance of a strong branch network structure to support small business lending. The size of a county’s economy and an extensive branch presence were the strongest factors associated with increased amounts of small business lending. This was especially true for metropolitan areas, though there were also strong associations in micropolitan and rural areas. The combined elements of greater financial access, strong economic growth and robust business lending worked synergistically in creating greater prosperity. Despite this, both the number of institutions and the number of bank branch locations continued to decline. This decline in branches has not been as severe among banks engaged in small business lending as it has for banks that do not provide small business loans.
Disrupting the relationship between local bank branches and small businesses threatens to constrain access to the capital and financial services required for a successful economy. This is especially critical for the success of small businesses which have managed to survive the COVID-19 pandemic, as they emerge and resume more normal operations. While the ranks of the largest lenders grew during the study period, those of smaller lenders decreased precipitously. For institutions involved in small business lending, we found that the number making small business loans declined unevenly over the period. This is concerning, considering the well-documented importance of relationships in small business lending. However, lacking marketwide small business loan data, we cannot tell whether the market share of large banks are increasing relative to small banks. The degree to which mergers and acquisitions, coupled with branch closures, disrupt existing relationships could have profound impact on small businesses seeking capital. The recent handling of the PPP lending program by the Small Business Administration and U.S. Treasury that encouraged banks to prioritize their larger, existing customers[53] is a vivid example of why banking relationships are crucial for business survival.[54]
It is difficult to discern whether small business lending has changed in areas that are most vulnerable in this era of consolidations and mergers. Small business lending in LMI tracts of large metropolitan areas appeared to grow at the same rate as lending in MUI tracts. However, there were wide gaps in lending to LMI tracts in rural and micropolitan areas. The dollar amount of micropolitan lending in LMI tracts was only 12% that of MUI tracts. This could indicate deep disparities in loan access for business development in smaller cities and towns. Most troubling is that there is no reliable information about the small business lending of institutions with small asset sizes since they are exempt from CRA reporting. However, the decline in the number of small asset size banks indicates that this segment is suffering steep declines in the number of branches and in financial access. The combined effect of fewer and larger institutions with fewer branch locations could disrupt relationships between banks and small businesses. Additionally, the increasing proportion of lending made by banks with branches outside of the county indicates the need for modernization of assessment areas under CRA. Unfortunately, we cannot tell to what degree any of this impacts small banks because the data is not present.
On this point our findings suggest that the most critical step in the near term for regulators would be to collect additional data on small business lending in all of its forms. This includes the implementation of Section 1071 of the Dodd-Frank Act, which has the potential to shed light on the unmet credit needs of businesses throughout the United States. A reconsideration of how bank assessment areas are designated might also be in order, as non-local banks and credit card lenders are becoming more important to large banks offering small business loans.
Section 1071 and the collection of this data offers regulators and consumer advocates a window into this foundational sector of the economy. Better information in the marketplace could spur new products and investment in small businesses in underserved communities, including rural businesses and businesses owned by women and people of color. For the lending industry, this offers several potential benefits as well, since an accurate picture of the small business market also identifies business opportunities for lending that are opaque currently. This rare alignment of interests among lenders, businesses and the public is the first step in addressing the findings of this report.
References
Aguirregabiria, V., Clark, R., & Wang, H. (2016). The geographic flow of bank funding: Branch networks and local-market competition. Mimeo.
Amel, D. F., & Prager, R. A. (2016). Community bank performance: how important are managers? Review of Industrial Organization : An International Journal Published for the Industrial Organization Society, 48(2), 149–180. https://doi.org/10.1007/s11151-015-9497-5
Berger, A. N., Black, L. K. (2019). Small business lending: The roles of technology and regulation from pre-crisis to crisis to recovery. The Oxford Handbook of Banking, 430-469. doi:10.1093/oxfordhb/9780198824633.013.15
Berger, A. N., Cerqueiro, G. M., & Penas, M. (2015). Market size structure and small business lending: are crisis times different from normal times? Review of Finance, 19(5), 1965–1995.
Berger, A., Rosen, R.J., Udell, G, F. (2007). Does market size structure affect competition? The case of small business lending. Journal of Banking & Finance. Volume 31, Issue 1.Pages 11-33. ISSN 0378-4266. https://doi.org/10.1016/j.jbankfin.2005.10.010.
Berger, A. N., & Udell, G. F. (2002). Small business credit availability and relationship lending: the importance of bank organisational structure. The Economic Journal, 112(477), 53. https://doi.org/10.1111/1468-0297.00682
Berger, A. N., & DeYoung, R. (2001). The effects of geographic expansion on bank efficiency. Journal of Financial Services Research, 19(2–3), 163–184. doi:10.1023/A:1011159405433
Bezemer, D., Samarina, A., Zhang, L. (2020). Does mortgage lending impact business credit? Evidence from a new disaggregated bank credit data set. Journal of Banking & Finance. Vol 13.ISSN 0378-4266. Available at: https://doi.org/10.1016/j.jbankfin.2020.105760.
Calzada, J., Fageda, X., & Martínez-Santos, F. (2019). Mergers, branch consolidation and financial exclusion in the US bank market. http://diposit.ub.edu/dspace/bitstream/2445/146681/1/E19-397_Calzada%2BFageda%2BMtnezSantos.pdf
Cherpack, P. L., & Jones, B. W. (2013). Community bank proactive risk management: concentration management, stress testing and capital planning. Journal of Risk Management in Financial Institutions, 6(4), 411–432.
Ding, L., & Reid, C. K. (2020). The Community Reinvestment Act (CRA) and bank branching patterns. Housing Policy Debate, 30(1), 27–45. https://doi.org/10.1080/10511482.2019.1665836
Fang, C., & Yeager, T. J. (2020). A historical loss approach to community bank stress testing. Journal of Banking and Finance, 118. https://doi.org/10.1016/j.jbankfin.2020.105831
Federal Deposit Insurance Corporation. (2018). FDIC small business lending survey. Retrieved from: https://www.fdic.gov/bank/historical/sbls/full-survey.pdf
Federal Deposit Insurance Corporation. (2012). FDIC Community Banking Study. Retrieved from: https://www.fdic.gov/regulations/resources/cbi/report/cbi-full.pdf
Federal Deposit Insurance Corporation. (2012). Community banking by the numbers. Paper presented at FDIC’s Future of Community Banking Conference, Feb. 16, 2012). Retrieved from: https://www.fdic.gov/news/events/communitybanking/community_banking_by_the_numbers_clean.pdf
Federal Reserve Board. (2019). Perspectives from main street: Bank branch access in rural communities. Board of Governors of the Federal Reserve System. Retrieved from: https://www.federalreserve.gov/publications/files/bank-branch-access-in-rural-communities.pdf
GAO. (2012). Community banks and credit unions: Impact of the dodd-france act depends largely on future rule makings. GAO-12-881. Retrieved from: https://www.gao.gov/assets/650/648210.pdf
Jagtiani, J., Kotliar, I., & Maingi, R. Q. (2016). Community bank mergers and their impact on small business lending. Journal of Financial Stability, 27, 106–121.
Liberti, J. M., & Petersen, M. A. (2019). Information: Hard and soft. Review of Corporate Finance Studies, 8(1), 1-41.
Lee, A., Mitchell, B., Lederer, A., Williams, J., Bone, S., Christensen, G. (2019). Divestment, discouragement and inequity in small business lending. Retrieved from: https://ncrc.org/disinvestment/
Lux, M., and R. Greene, 2015, The state and fate of community banking. Harvard Kennedy School, M-RCBG Associate Working Paper Series No. 37. Retrieved from: https://www.hks.harvard.edu/centers/mrcbg/publications/awp/awp37
McCord, R., Prescott, E., & Sablik, T. (2015). Explaining the decline in the number of banks since the great recession. Federal Reserve Bank of Richmond Economic Brief EB12-03.
McKee, G., & Kagan, A. (2018). Community bank structure an x-efficiency approach. Review of Quantitative Finance and Accounting, 51(1), 19–41. https://doi.org/10.1007/s11156-017-0662-9
NCRC. (2007). Access to capital and credit for small businesses in appalachia. Prepared for the Appalachian Regional Commission. Retrieved from: https://ncrc.org/wp-content/uploads/2007/05/ncrc%20study%20for%20arc.pdf
NCRC. (2013). Access to capital and credit in appalachia and the impact of the financial crisis and recession on commercial lending and finance in the region. Prepared for the Appalachian Regional Commission. Retrieved from: https://ncrc.org/access-to-capital-and-credit-in-appalachia-and-the-impact-of-the-financial-crisis-and-recession-on-commercial-lending-and-finance-in-the-region/
Nguyen, H. L. Q. (2019). Are credit markets still local? Evidence from bank branch closings. American Economic Journal: Applied Economics, 11(1), 1-32.
Rauterkus, A., & Munchus, G. (2014). Geographical location: does distance matter or what is the value status of soft information? Journal of Small Business and Enterprise Development, 21(1), 87–99. https://doi.org/10.1108/JSBED-03-2013-0026
Sengupta, R., & Dice, J. (2019). Did local factors contribute to the decline in bank branches? Economic Review, 104(3), 43–64. Retrieved from: https://www.kansascityfed.org/~/media/files/publicat/econrev/econrevarchive/2019/3q19senguptadice.pdf
Silver, J. (2018). The importance of CRA assessment areas and bank branches. Retrieved from: https://ncrc.org/the-importance-of-cra-assessment-areas-and-bank-branches/
Smoluk, B. J. (2020). Community banks, money and labour productivity. Economic Notes, 49(1). https://doi.org/10.1111/ecno.12154
Xuy, Y. (2018). The importance of brick-and-mortar bank offices for lending: Evidence from small business and home mortgage lending. Retrieved from: https://drive.google.com/file/d/17BHqJppQd70PprkI261IyvpBeYfBns0z/view
Appendix
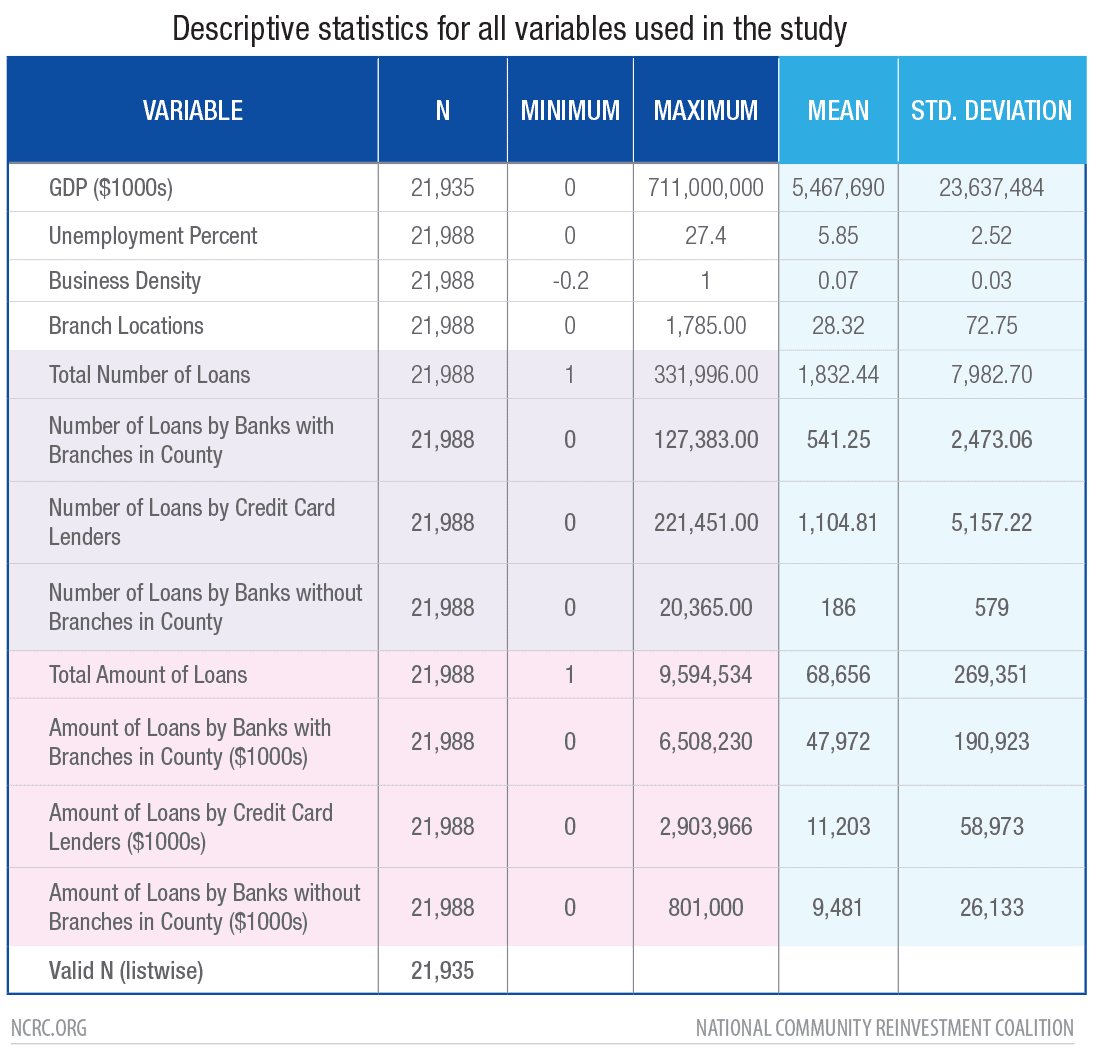
A-1 Descriptive statistics
Descriptive statistics at the county level cover the period from 2012 to 2018. During the period Los Angeles County dominated with the highest GDP, number and amount of loans in the nation in 2018. It consistently leads the nation in the number of bank branches, which peaked in 2014 at 1,619 and diminished to 1,571 by 2017. On the other hand, Arthur County, NE, a county of 465 residents and no bank branches, had the lowest GDP and only 1 credit card and 4 small business loans in 2012. (564 counties had no branch locations at all in 2012, diminishing to 525 in 2018.) The average number of branches per county was 20.23. Unemployment for the period was an average of 5.86%, reaching a high in Imperial County, CA of 27.4% in 2012. (Imperial and Colusa Counties in CA and Yuma County, AZ consistently had the highest unemployment levels in the nation). Several counties in North Dakota had the lowest unemployment during the period due an oil boom from exploitation of the Bakken formation in that state.
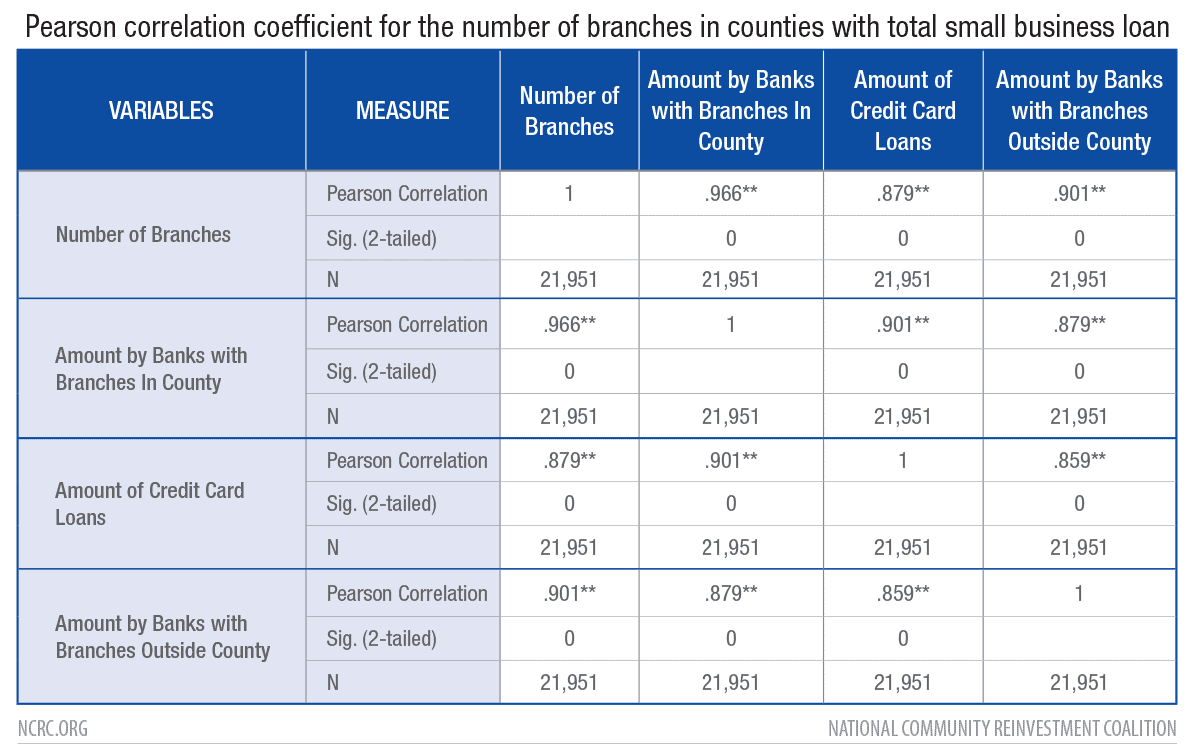
A-2 Pearson’s correlation coefficient for the number of branches in counties with total small business loan amounts by banks with branches in or outside the county and credit card loans. (Source: FFIEC CRA Tabel D1-1, 2012-2018 and FDIC Summary of Deposits file 2012-2018.)
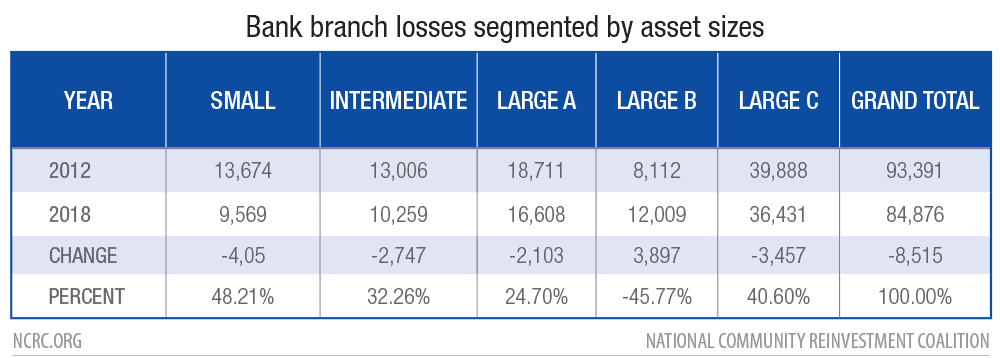
A-3 Ancillary data on bank branch and institutional changes 2012-2018, segmenting large banks
Bank branch losses segmented by asset sizes (Community = assets $1B-$10B, Small Regional = assets $10B-$50B, Large Regional to National = assets over $50B)
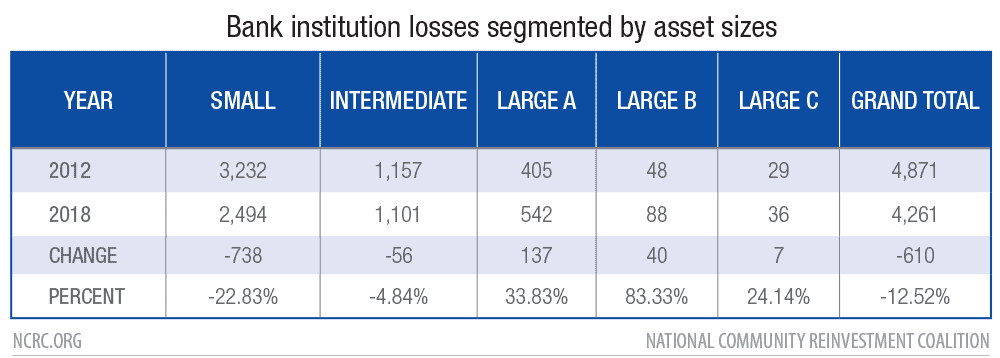
Bank institution losses segmented by asset sizes (Community = assets $1B-$10B, Small Regional = assets $10B-$50B, Large Regional to National = assets over $50B)
A-4
Definitions
Low- to moderate-income (LMI): Census tracts where median family income is 50% or less in the case of low-income, or 50% – 80% for moderate-income, of the median family income of the entire metropolitan area, or state where they are located. The criteria for LMI census tracts is defined under the Community Reinvestment Act (CRA), and the Federal Financial Institutions Investigations Council is responsible for the yearly assignment of qualified census tracts.
Middle- to upper-income (MUI): Census tracts where median family income is 80% to 120%, in the case of middle-income, and over 120% for upper-income, of the median family income of the entire metropolitan area, or state where they are located.
Metropolitan: A county located in a core based statistical area (CBSA) identified by the 2010 census as having more than 50,000 population.
Micropolitan: A county located in a core based statistical area (CBSA) identified by the 2010 census as having more than 10,000 but less than 50,000 population.
Rural: A county not located in a CBSA.
Branch: A customer facing office that accepts deposits. In the FDIC Summary of Deposits these branches are identified with service type 11 or 12.
Small business loan: A loan to a business for an amount under $1 million reported under the Community Reinvestment Act.
Large Bank: A bank with assets over the CRA small-bank reporting threshold of around $1.25 billion[55].
[1] https://coronavirus.house.gov/news/press-releases/new-ppp-report-shows-trump-administration-and-big-banks-left-behind-struggling
[2] Liberti, J. M., & Petersen, M. A. (2019). Information: Hard and soft. Review of Corporate Finance Studies, 8(1), 1-41.
[3] Branch service type 11 defined as full service brick and mortar office, and 12 full service retail office,
[4] Calzada, J., Fageda, X., & Martínez-Santos, F. (2019). Mergers, branch consolidation and financial exclusion in the US bank market. http://diposit.ub.edu/dspace/bitstream/2445/146681/1/E19-397_Calzada%2BFageda%2BMtnezSantos.pdf
[5] Nguyen, H. L. Q. (2019). Are credit markets still local? Evidence from bank branch closings. American Economic Journal: Applied Economics, 11(1), 1-32.
[6] All small business lending figures cited in this report were taken from data made available under the Community Reinvestment Act (CRA), and therefore are limited to lending reported by large asset-size banks. The asset-size threshold for large banks varies year-to-year under CRA, but were set at $1.252 billion at the beginning of our study period in 2012.
[7] Berger, A. N., Black, L. K. (2019). Small business lending: The roles of technology and regulation from pre-crisis to crisis to recovery. The Oxford Handbook of Banking, 430-469. doi:10.1093/oxfordhb/9780198824633.013.15
[8] Ding, L., & Reid, C. K. (2020). The community reinvestment act (cra) and bank branching patterns. Housing Policy Debate, 30(1), 27–45. https://doi.org/10.1080/10511482.2019.1665836
[9] Berger, A. N., Black, L. K. (2019). Small business lending: The roles of technology and regulation from pre-crisis to crisis to recovery. The Oxford Handbook of Banking, 430-469. doi:10.1093/oxfordhb/9780198824633.013.15; Fang, C., & Yeager, T. J. (2020). A historical loss approach to community bank stress testing. Journal of Banking and Finance, 118. https://doi.org/10.1016/j.jbankfin.2020.105831
[10] Berger, A. N., Black, L. K. (2019). Small business lending: The roles of technology and regulation from pre-crisis to crisis to recovery. The Oxford Handbook of Banking, 430-469. doi:10.1093/oxfordhb/9780198824633.013.15
[11] Bezemer, D., Samarina, A., Zhang, L. (2020). Does mortgage lending impact business credit? Evidence from a new disaggregated bank credit data set. Journal of Banking & Finance. Vol 13.ISSN 0378-4266. Available at: https://doi.org/10.1016/j.jbankfin.2020.105760.
[12] Nguyen, H. L. Q. (2019). Are credit markets still local? Evidence from bank branch closings. American Economic Journal: Applied Economics, 11(1), 1-32.
[13] Ibid
[14] Xuy, Y. (2018). The importance of brick-and-mortar bank offices for lending: Evidence from small business and home mortgage lending; Silver, J. (2018). The importance of cra assessment areas and bank branches. Retrieved from: https://ncrc.org/the-importance-of-cra-assessment-areas-and-bank-branches/
[15] Lux, M., and R. Greene, 2015, The state and fate of community banking. Harvard Kennedy School, M-RCBG Associate Working Paper Series No. 37. Retrieved from: https://www.hks.harvard.edu/centers/mrcbg/publications/awp/awp37
[16] Berger, A. N., & DeYoung, R. (2001). The effects of geographic expansion on bank efficiency. Journal of Financial Services Research, 19(2–3), 163–184.
[17] Berger, A. N., & Udell, G. F. (2002). Small business credit availability and relationship lending: the importance of bank organisational structure. The Economic Journal, 112(477), 53.
[18] GAO. (2012). Community banks and credit unions: Impact of the dodd-france act depends largely on future rule makings. GAO-12-881.
[19] Jagtiani, J., Kotliar, I., & Maingi, R. Q. (2016). Community bank mergers and their impact on small business lending. Journal of Financial Stability, 27, 106–121.
[20] Federal Deposit Insurance Corporation. (2012). FDIC Community Banking Study. Retrieved from: https://www.fdic.gov/regulations/resources/cbi/report/cbi-full.pdf
[21] Ibid.
[22] Smoluk, B. J. (2020). Community banks, money and labour productivity. Economic Notes, 49(1).
[23] McCord, R., Prescott, E., & Sablik, T. (2015). Explaining the decline in the number of banks since the great recession. Federal Reserve Bank of Richmond Economic Brief EB12-03; McKee, G., & Kagan, A. (2018). Community bank structure an x-efficiency approach. Review of Quantitative Finance and Accounting, 51(1), 19–41.
[24] Amel, D. F., & Prager, R. A. (2016). Community bank performance: how important are managers? Review of Industrial Organization : An International Journal Published for the Industrial Organization Society, 48(2), 149–180.
[25] Berger, A., Rosen, R.J., Udell, G, F. (2007). Does market size structure affect competition? The case of small business lending. Journal of Banking & Finance. Volume 31, Issue 1; Berger, A. N., Cerqueiro, G. M., & Penas, M. (2015). Market size structure and small business lending: are crisis times different from normal times? Review of Finance, 19(5), 1965–1995.
[26] Aguirregabiria, V., Clark, R., & Wang, H. (2016). The geographic flow of bank funding: Branch networks and local-market competition. Mimeo.
[27] Berger, A. N., Black, L. K. (2019). Small business lending: The roles of technology and regulation from pre-crisis to crisis to recovery. The Oxford Handbook of Banking, 430-469; Cherpack, P. L., & Jones, B. W. (2013). Community bank proactive risk management: concentration management, stress testing and capital planning. Journal of Risk Management in Financial Institutions, 6(4), 411–432.
[28] Federal Deposit Insurance Corporation. (2018). FDIC small business lending survey. Retrieved from: https://www.fdic.gov/bank/historical/sbls/full-survey.pdf; Federal Reserve Board. (2019). Perspectives from main street: Bank branch access in rural communities. Board of Governors of the Federal Reserve System. Retrieved from: https://www.federalreserve.gov/publications/files/bank-branch-access-in-rural-communities.pdf, Lee, A., Mitchell, B., Lederer, A., Williams, J., Bone, S., Christensen, G. (2019). Divestment, discouragement and inequity in small business lending. Retrieved from: https://ncrc.org/disinvestment/
[29] Federal Reserve Board. (2019). Perspectives from main street: Bank branch access in rural communities. Board of Governors of the Federal Reserve System. Retrieved from: https://www.federalreserve.gov/publications/files/bank-branch-access-in-rural-communities.pdf
[30] Rauterkus, A., & Munchus, G. (2014). Geographical location: does distance matter or what is the value status of soft information? Journal of Small Business and Enterprise Development, 21(1), 87–99.
[31] NCRC. (2007). Access to capital and credit for small businesses in appalachia. Prepared for the Appalachian Regional Commission. Retrieved from: https://ncrc.org/wp-content/uploads/2007/05/ncrc%20study%20for%20arc.pdf
[32] NCRC. (2013). Access to capital and credit in appalachia and the impact of the financial crisis and recession on commercial lending and finance in the region. Prepared for the Appalachian Regional Commission. Retrieved from: https://ncrc.org/access-to-capital-and-credit-in-appalachia-and-the-impact-of-the-financial-crisis-and-recession-on-commercial-lending-and-finance-in-the-region/
[33] Berger, A. N., Black, L. K. (2019). Small business lending: The roles of technology and regulation from pre-crisis to crisis to recovery. The Oxford Handbook of Banking, 430-469; Federal Deposit Insurance Corporation. (2018). FDIC small business lending survey. Retrieved from: https://www.fdic.gov/bank/historical/sbls/full-survey.pdf
[34] Sengupta, R., & Dice, J. (2019). Did local factors contribute to the decline in bank branches? Economic Review, 104(3), 43–64. Retrieved from: https://www.kansascityfed.org/~/media/files/publicat/econrev/econrevarchive/2019/3q19senguptadice.pdf
[35] Nguyen, H. L. Q. (2019). Are credit markets still local? Evidence from bank branch closings. American Economic Journal: Applied Economics, 11(1), 1-32.
[36] Calzada, J., Fageda, X., & Martínez-Santos, F. (2019). Mergers, branch consolidation and financial exclusion in the US bank market.
[37] https://www.fdic.gov/regulations/resources/call/sod.html
[38] https://www.fdic.gov/regulations/resources/call/sod.html
[39] https://www.ffiec.gov/cra/pdf/2020_Asset_Size_Threshold.pdf
[40]https://www.federalreserve.gov/supervisionreg/community-and-regional-financial-institutions.htm#:~:text=The%20Federal%20Reserve%20defines%20community,%2410%20billion%20and%20%24100%20billion.
[41] https://www.ffiec.gov/hmcrpr/cra19tables1-5.pdf#Table1
[42]https://www.bea.gov/data/gdp/gdp-county-metro-and-other-areas
[43] https://www.huduser.gov/portal/datasets/usps.html
[44] https://www.bls.gov/lau/#tables
[45] https://www.ers.usda.gov/data-products/rural-urban-continuum-codes/
[46] Adjustments for inflation were made using the U.S. Bureau of Labor Statistics CPI inflation calculator https://www.bls.gov/data/inflation_calculator.htm
[47] The 2019 Federal Reserve study closely matches our calculations over the same period. However, the Federal Reserve excluded counts for branches in counties that underwent changes in their FIPS codes, while ours reapportions the counts to the new codes. https://www.federalreserve.gov/publications/files/bank-branch-access-in-rural-communities.pdf
[48] https://www.washingtonpost.com/business/2020/11/11/commercial-real-estate-economy/
[49] Lenders making high volume and smaller dollar loans under an average of $15,000.
[50] http://www.oecd.org/coronavirus/policy-responses/e-commerce-in-the-time-of-covid-19-3a2b78e8/
[51] https://bankingjournal.aba.com/2020/09/how-covid-19-is-accelerating-the-demand-for-efficiency-and-automation-in-risk-management/
[52] https://independentbanker.org/2020/11/covid-19-is-accelerating-commercial-loan-automation/
[53] https://coronavirus.house.gov/sites/democrats.coronavirus.house.gov/files/PPP%20Report%20Final%20%283%29.pdf
[54] https://www.reuters.com/article/us-health-coronavirus-usa-ppp/u-s-treasury-urged-ppp-lenders-to-focus-on-existing-customers-congress-report-idUSKBN2712XG
[55] Thresholds are adjusted yearly https://www.ffiec.gov/cra/pdf/2020_Asset_Size_Threshold.pdf
