— Key Takeaways
- Between 2008 and 2020, over 13,000 bank branches closed in the U.S., representing 14% of all branches.
- Branches are critical to local business lending, financial access, and as employers and commercial tenants for local communities.
- In places where few branches existed to begin with, closures create ‘branch deserts’ and force consumers and small businesses to seek alternative financial providers.
- Closures disparately impact places where few branches existed, including rural and low-income urban areas.
- Bank mergers continue to drive large numbers of branch closures.
— Key FINDINGS
- Since 2008, banks have closed 13,432 bank branches across the United States. That’s a loss of over 14% of all branches that were in operation at that time.
- Nationally, 81,586 branches were in operation as of June 30, 2020, a 1,253 (1.51%) drop in branches from 2019’s numbers and a 4,407 (5.13%) drop from 2017’s numbers. Of those that closed since 2017, 1,020 branches (23%) were closed in low and moderate-income (LMI) neighborhoods.
- The five states that lost the largest share of branches from 2017-2020 were Alaska, Oregon, New Jersey, Michigan and North Carolina. No states saw the number of branches increase.
- Among the 50 metros with the most branches in 2017, the five that lost the largest share of branches were Hartford, Connecticut, New York, New York, Portland, Oregon, Chicago, Illinois, and Phoenix, Arizona.
- SunTrust and BB&T, which merged this year to form Truist, closed a total of 565 branches in the 4-year period, or 16.5% of their combined branches. Although a common benefit for banks that wish to merge, each closure represents less access to financial services for residents of those communities where Truist closed a branch.
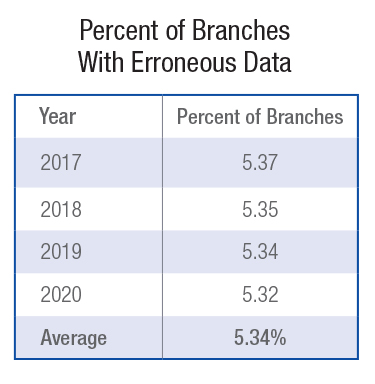
- About 5.5% of the branches listed in the FDIC database each year have erroneous address information that makes it difficult to really know where every branch is located.
- As of October 2020, the COVID-19 pandemic does not appear to have resulted in an increase in the rate of permanent branch closures nationally, and in July, August and September 2020, branch losses were much lower than in the years previously.
Jad Edlebi, GIS Specialist, Research, NCRC
Introduction
A profound financial crisis has gripped the economy because of the current COVID-19 pandemic. As a result, future bank branch availability remains uncertain. Previous NCRC research discovered that a total of 7,779 branches were lost between 2008 and 2017, totalling a near 10% loss since 2009 nationally. 1,771 of those branches were lost between 2016 and 2017 alone,
In this report, NCRC extended our previously published analysis of bank branch closures to look at changes from 2017 through 2020. Using the interactive visualization below, we explored closures over that time period by place or bank. We looked at branch closures by both neighborhood income and racial minority share.
Metro areas such as Milwaukee, Buffalo, Philadelphia and Detroit have seen further bank branch decline – as much as 8% more than the national average since 2009. Several factors have been involved in the shift in bank branch availability since the Great Recession. Financial institutions may have either closed, consolidated or merged branches as technological innovations shifted resources to focus more on online transactions.
In this brief, NCRC Research explored the impact, as well as consequences, of the shifting in bank branch availability across the nation.
Methodology
For this study, we used the Summary of Deposits data from the Federal Deposit Insurance Corporation (FDIC) for 2017-2020. We restricted our study to service types 11 and 12, which include full-service brick & mortar locations and retail locations inside other businesses. Our geographic scope includes all 50 states and the District of Columbia. Each year was compared and changes in bank branches at the tract, county, metro, state and national levels were calculated based on the previously mentioned criteria.
We stratified the census tracts in each core-based statistical area (CBSA) into racial quartiles based on the minority population of the CBSA. The quartile with the lowest percent of minority population is “Low Minority,” the second quartile is “Moderate Minority,” the third quartile is “Medium Minority” and the quartile with the largest percent of minority population is “High Minority.” This is similar to the way in which census tracts are stratified by income and represents a better picture of locally relevant racial segregation and minority populations than a simple majority-minority designation. This approach provides more granularity in determining access to banking for communities of color and better measures where communities of color are impacted.
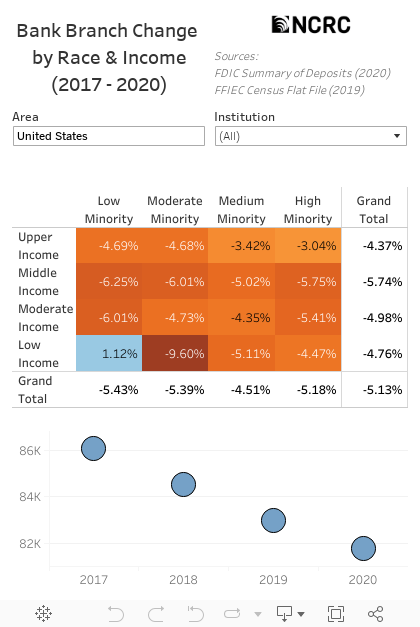
This tool shows the change in bank branch availability in the 50 states and DC by income and minority levels between the years of 2017 and 2020. Type in a County, State, or CBSA to filter the results. Source: FDIC Summary of Deposits (2017-2020), FFIEC Census (2019)
After calculating and assigning to quartiles, we determined the branch closure data for census tracts that were both medium-to-high minority (MHM) and LMI. We then compared them to changes in low-to-moderate minority (LMM) and middle-to-upper income (MUI) census tracts. This was then broken down by financial institutions at the national level.
Limitations to this study include the overall weakness of the FDIC bank branch data. In each year covered by this report, approximately 5.5% of branch locations could not be located precisely. This is due to reporting errors on the part of the bank. We suggest that the FDIC implement a geocoding function to the summary of deposit submission that requires the bank to identify the proper address of their locations. In addition, Credit Unions are not included in this analysis.
Losses by Geography
At the national level, the total number of bank branches declined by 4,407, a 5.13% drop between 2017 and 2020. Of those, 1,020 branches have closed in LMI neighborhoods. Nationally, LMI neighborhoods lost as many as 6% of their branches with state and local impacts showing significantly higher losses. Although MHM neighborhoods displayed a lower number of bank branch closings nationally, this disproportionally affects those neighborhoods due to the already reduced presence of branches in MHM communities.
All fifty states reported a net decline in branches from 2017 through 2020. States such as Alaska, Oregon, New Jersey, Michigan and North Carolina had lost 7.7% to 9.6% of their branch locations, with Alaska showing an exceptional decrease of 15.9%. In Alaska, this hit minority communities especially hard, with a drop of almost 18% of branches that existed in MHM communities. Although other states had lower branch losses, some communities in Louisiana lost up to 23.6% of their branches in low-income, high-minority neighborhoods. In Idaho and Hawaii, the number of branches that existed in LMI neighborhoods in 2017 declined by up to 16% by 2020.
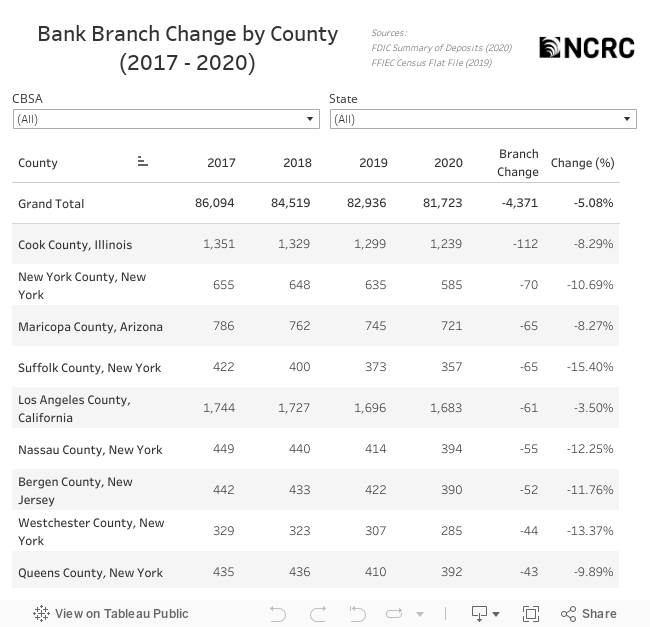
Interactive list of counties showing bank branch availability by year. Select a CBSA or State to filter the results. Source: FDIC Summary of Deposits (2017-2020), FFIEC Census (2019)
Metro areas were impacted at varying intensities depending on population size. Major metro areas such as New York, Chicago and Phoenix had the largest share of losses – up to 9.6%. Chicago, had a drop of 8.5% overall, and there were greater drops in LMI and MHM census tracts, as high as 33.3%. Banks in Portland, a smaller metro area than Chicago, still closed roughly 9.5% of branches. Smaller and medium metro areas show a higher impact, particularly in Florida. Jacksonville, Fort Myers and Port St. Lucie lost as much as 13.3% of their branches, with even greater drops, as much as 50%, in LMI tracts. Hartford lost 12.3% of its branches with nearly half of the branch closings occuring in MHM tracts. Some CBSAs reported much higher closure rates in high minority communities. In the New Orleans metro area, 7% of branches closed during the study period. However, in high minority neighborhoods almost 14% of branches closed and all of those closures were in LMI census tracts.
Branch loss at the county-level revealed that most counties did see a decline in branch numbers, but many rural counties did see minor increases in branches from 2017-2020. Losses peaked at 113 branches in Cook County, Illinois for this study period. The issue of disproportionate impacts can be seen in counties like Suffolk County, New York, a suburban county of the New York City metro area, where 15.4% had closed with low-income and MHM communities losing almost all of their branches that had existed in 2017. Delaware County, Pennsylvania, another suburban county that neighbors Philadelphia, experienced a similar share of losses with about 38% of the losses occurring in MHM communities.
Losses by Bank Entity
As the visualization demonstrates, some banks show dramatic swings in the number of branches in operation each year. These changes occur for a variety of reasons, including mergers and acquisitions as well as strategic decisions to reduce the bank’s physical footprint or relocate branches. Relocations often result in a branch closure followed by a new opening, but that opening might not take place for some time.
Associating consolidations with bank mergers is applicable in some cases when analyzing branch counts for each institution during the study period. For example, BB&T and SunTrust Banks closed 565 (16.5%) branches nationally due to their merger into what is now Truist Bank. In this analysis we combined the branch networks of BB&T and SunTrust due to the market share of their combined entity. However, this is not possible throughout the entire dataset.
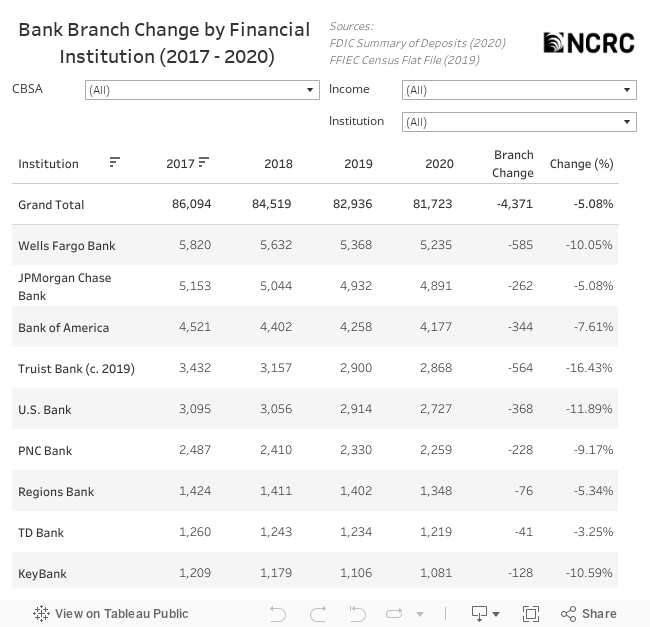
Interactive list of financial institutions showing bank branch availability by year. Select a CBSA or Institution to filter the results. Source: FDIC Summary of Deposits (2017-2020), FFIEC Census (2019)
Other large banks such as Wells Fargo, JPMorgan Chase and Bank of America had losses up to 10.1% nationally, with potentially greater consequences due to the sizes of their branch networks in metro area markets. Capital One closed nearly 32% of the 640 branches it operated in 2017, including 81 branches in New York, 30 in Texas and 27 in Louisiana. Capital One exited several markets where it had a substantial presence, changing financial services access for entire communities, and dramatically altering the bank’s regulatory profile.
By 2020, Wells Fargo closed almost 10% of its branches that had existed in LMI communities in 2017. Although the numbers may seem small, the scarcity of bank branches in LMI neighborhoods to begin with means more losses will have a lasting impact on access to capital for increasing homeownership, entrepreneurship and wealth.
Losses due to COVID-19 in 2020
As the economic impact of the COVID-19 pandemic plays out, it is certain to affect branch access and availability. An analysis of branch change records from the FDIC suggests that as yet there has been no permanent impact from the pandemic on branch numbers. The data used in this report show branch numbers as of June 30, 2020. However, the FDIC publishes data each week on branch changes that are processed by banks. Based on this data, in the third quarter of 2020, there was a substantial reduction in the rate of branch closures. Beginning in July, net branch loss declined sharply from previous years, with 34 branches added. There were also relatively small numbers of branches lost in August and September in comparison to recent previous years.
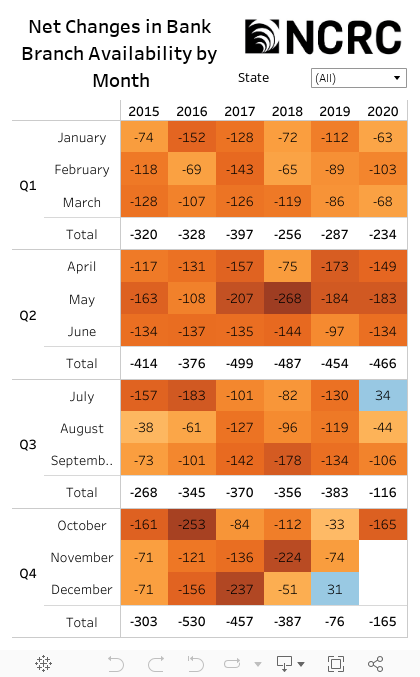
Using FDIC branch changes processed from January 1, 2015 through October 31, 2020 this chart shows the net changes for each month based on the effective date of the opening or closure of branches. Source: FDIC BankFind Suite – https://banks.data.fdic.gov/bankfind-suite/oscr
This suggests that not only has the pandemic not yet resulted in an acceleration of branch closures but that it may have slowed the rate of closure, at least temporarily. The reasons for this are beyond the scope of this report but would be a valid line of inquiry for future research. Several possible explanations may be related to the disruption of business wrought by the pandemic. For example, with many branches closed or offering reduced services, local permitting offices operating at reduced capacity and commercial rents in freefall, banks might be reassessing their branch footprints or waiting until the economic outlook is clearer before making commitments related to branch changes. In October, the FDIC reported a larger number of closures than in previous years. Whether this indicates that banks are closing branches that they were unable to close in the previous three months due to pandemic lockdowns is unknown.
Conclusion
Since 2017, the number of customer facing branches across the U.S. declined by 5%, and since 2008 we have seen over 13,000 branches close across the country. This continues trends observed in prior NCRC research, a trend likely to continue as banks seek to merge or acquire other banks at an astonishing rate.
Branch closures and relocations are disruptive for consumers and communities, severing relationships with local businesses and community stakeholders. A branch closure means the loss of a valuable commercial tenant and the elimination of jobs in local communities. While the closures might appear to be equitable, as measured by the number of branches closing across lower-income and minority communities, the lower access to banks in those communities already guarantees that the closures will have a greater impact there.
Mobile and internet banking are often cited as the key drivers of bank branch closures. However, in 2019 the FDIC found that despite the growing use of those amenities, 87% of banking consumers had still visited a branch in the past year. Over 28% of consumers visited a branch at least ten times in that year. Clearly, consumers still think a branch matters. The cost of the branch, and the rapid pace of bank mergers since the Great Recession are more likely the driving factor in many closures. In the case of Truist, the cost savings in eliminating duplicate branches was clearly identified as a positive step for bank shareholders.
[Truist] expected $1.6 billion in annual cost savings, primarily coming from eliminating duplication, including potentially as many as 740 overlapping branches. Source: Winston-Salem Journal
While bank locations must adapt to the needs of the business in a rapidly changing industry, the impact to the communities they are chartered to serve is often forgotten. It is easy to assume that mobile and internet banking will fill the gap, yet research shows that this is not the whole story.
Branches still matter, and research consistently shows that not only do consumers value the presence of a local branch when they decide who to bank with but it also helps them decide if they should use a bank at all. People that are unbanked report that a lack of branch access is a major reason for them avoiding the banking system altogether. Small businesses rely on local branches for a number of critical services and there remains a strong correlation between small business lending and bank branches.
COVID-19 has brought not just a pandemic, but a crippling recession to our doorstep. The infrastructure of banking and finance extends into neighborhoods via the branch. If we want to assure that our communities can recover from the impact of this virus, and that businesses can emerge from the cold winter with access to credit they desperately need we will pay close attention to the loss of branches. This is especially important in places where there are already few banking options. If small businesses are to bring back staff and make needed modifications and repairs to accommodate the reality of a post-pandemic world, they need the relationships that the local bank branch facilitates.
