REDLINED:
KeyBank Failed Black America Despite Its Commitments to Improve
November 2022
Jason Richardson, Senior Director, Research, NCRC
Jad Edlebi, GIS Data Engineer, Research, NCRC
— Key Takeaways
KeyBank had the lowest percent of mortgage originations to Black borrowers among the 50 largest mortgage lenders. It was also third-to-last in that group in percentage of originations to people of color and second-to-last in percentage of originations in majority-minority and low- and moderate-income (LMI) neighborhoods within the markets it serves.
KeyBank appears to have been engaged in systemic redlining. KeyBank limited its home mortgage lending in census tracts where Black residents are clustered. It approved mortgages for low-income White applicants at a higher rate than for high-income Black applicants.
KeyBank promised to provide greater support to low-income communities, then drastically reduced its share of home purchase lending to LMI borrowers. Bank executives pledged in writing to better support marginalized communities. The share of KeyBank’s home purchase loans going to African Americans and to LMI borrowers dropped by double digits from 2018 to 2021.
Introduction
KeyBank disregarded commitments to improve lending to Black homeowners and potential homeowners. Federal data shows KeyBank now ranks at the bottom among the 50 largest mortgage lenders in the nation in the percentage of its borrowers who are Black, live in majority-minority or LMI neighborhoods and are people of color. Its uniquely bad performance in home mortgage originations is not limited to topline data like share of borrowing and rate of approval. New maps of KeyBank’s mortgage lending in 2021 reveal the bank is effectively walling out Black neighborhoods in several cities, and lending mostly to non-Black buyers in the few cities where it does make loans tied to homes in areas with concentrated Black populations.
The failures revealed in the following analysis are especially damning in the context of KeyBank’s stated values and of formal promises it made to the communities it serves. While pursuing regulatory approval for a deal to acquire First Niagara, KeyBank executives in 2016 committed to making the merged firm a leader in lending to marginalized borrowers. The bank emphasized that this commitment extended to the new markets it would enter by acquiring First Niagara:
“KeyBank’s Plan provides for Key to achieve levels of mortgage production to LMI borrowers and in LMI communities, both urban and rural, that will place it at or above its peers.”
– KeyBank 2017 National Community Benefits Plan (emphasis added)
Bank regulators approved the deal, referencing KeyBank’s pledges to LMI communities in their formal written decision.[1] Yet five years later the bank has reduced the share of its home purchase lending that involves Black borrowers, in almost every metro area it serves. In some cases the bank’s overall rate of home purchase lending exploded but Black and LMI borrowers were left behind as KeyBank ramped up home purchase lending.
KeyBank’s leaders promised to increase support to “underserved communities.”[2] They did the opposite. KeyBank decreased the share of its home purchase lending made to Black borrowers in all but three of the major metropolitan areas it serves, and decreased the LMI borrowers’ share of such lending in all but one of those markets from 2018 to 2021. Even in those metros, the marginal rises in such lending the bank achieved generally trailed the gains made by its local competitors. In some of these cities, KeyBank’s total loan volumes increased dramatically while the share going to Black borrowers fell – indicating that the company’s leaders pursued a growth strategy that left out Black families.
Shortly after completing the 2016 merger, KeyBank touted the deal as a key driver of new profitability in its annual report to shareholders (see below). The company used this increased profitability to dramatically increase its dividend payments[3] – which means that resources which could have been used to fulfill the commitments it made to the marginalized went to investors instead.
KeyBank executives used the 2016 merger to dramatically expand the bank’s home purchase lending business. But it effectively excluded Black families from that expansion, instead growing the home purchase arm of its profit-seeking efforts by focusing investments on wealthier, whiter borrowers.
The same communities KeyBank executives pledged to aid in 2016 have been left behind – and KeyBank is in the unenviable position of ranking 50th among the 50 largest mortgage lenders in mortgage lending to Black borrowers.
Making Profits & Breaking Promises
Large banks seeking to acquire competitors through a merger requiring federal approval will sometimes make formal commitments to the most vulnerable residents of the communities to be affected by the proposed tie-up. Cleveland-based KeyBank signed such a deal in 2016, as it sought to close its acquisition of First Niagara and expand its base of both customers and profit opportunities.
The community benefits agreement (CBA) KeyBank entered into following lengthy negotiations with NCRC included numerous specific promises. These detailed line items added up to a simpler overarching pledge: KeyBank planned to improve its lending to low- and moderate-income (LMI) borrowers.
Over many years of CBA negotiations, NCRC has seen that merger approvals are not the sole motivator bringing executives to the table with community organizations. Banks attend listening sessions and commit long hours to hammering out final details of their commitments because they care about serving the long-term development needs in the communities where their customers live. But successfully struck agreements do also tend to help banks win merger approvals, and thus increase profits. This was certainly the case for KeyBank in the CBA underlying this report.
KeyBank and NCRC announced the deal in March of 2016. When regulators formally greenlighted the KeyBank-First Niagara merger later that year, their written approval decisions specifically cited details of KeyBank’s CBA commitments to improve LMI lending.
The bank and its shareholders made a lot of money thanks in part to the completed deal. Two years later, KeyBank increased its dividend payments from 38 cents per share to 56 cents per share. Its 2018 annual report specifically cited “our successful First Niagara acquisition” as one driver of this growth in profit for insiders. The same report detailed double-digit percentage jumps in multiple revenue streams in 2017 that were “primarily due to the acquisition of First Niagara.”
These merger-derived profit increases demonstrate KeyBank had ample resources with which to keep the promises it made to LMI borrowers in the 2016 CBA.
When banks and community groups make these agreements, the main focus is on guiding investment into underserved communities and in the people who live in them. Such communities are heavily Black, Hispanic and/or LMI – but no other community in the country is as underserved as Black Americans. The neglect still burdening these communities reflects long-term segregation and explicitly racist 20th Century housing and lending policies. (Zhu, Goodman, & Zhu, 2022). This pattern of redlining has persisted despite the efforts of regulators and communities to enforce the Community Reinvestment Act (CRA), a 1977 law that requires banks to invest in the communities from which they take deposits.
KeyBank’s CBA laid out specific goals for increasing the bank’s investment in LMI communities, including mortgage lending. KeyBank committed to the following improvements in its investment in LMI mortgage borrowers;
- KeyBank will increase mortgage lending in low- and moderate-communities by $2.5 billion or 100% over the current rate of both institutions. Each market, including each of the First Niagara markets, should expect up to an average of a 20% compounded growth rate over the five-year period.
This CBA language is heavy on specific dollar figures and other quantitative language. But those are detailed reflections of a simpler, broader shared purpose understood by all participants in the process. A CBA is a bank’s commitment to improve lending performance to the underserved. KeyBank told the community groups it met with that it would make its homeownership business more inclusive of underserved communities.
Instead, as KeyBank pursued a major expansion in home purchase lending, it built that business by chasing white and wealthy borrowers.
Six years after KeyBank pledged to lead on homeownership among underserved communities, federal data on the borrower demographics of KeyBank’s home purchase loan portfolio paints a damning picture: Since signing the agreement and absorbing First Niagara via merger, KeyBank has in fact made fewer of its loans to LMI borrowers with each passing year.
In addition, there is a clear decline in the bank’s share of loans to Black borrowers. Nationally there is a high degree of overlap between Black and LMI borrowers. Overall, 37% of Black applicants for home loans from 2018 to 2021 were of low or moderate income. This figure rises to 40% for home purchase applicants. In this report, we provide a descriptive analysis of the decline in KeyBank’s lending to Black and LMI borrowers at the national level. We also look at the top markets where KeyBank’s lending is concentrated and discuss the uneven geography of KeyBank mortgage lending compared to other banks. In addition, we highlight the markets in which KeyBank’s lending performance is particularly notable. Our review of KeyBank’s lending data at the metro level reveals de facto redlining: KeyBank barely makes loans in areas where a large number of Black families reside. In most of its top markets, KeyBank also performs at or near the back of the pack in lending to Black borrowers in analyses of the area’s top 10 banks.
Overview of Analysis
Among the top 50 mortgage lenders[4] in 2021, KeyBank ranked dead last in loans made to a Black borrower. KeyBank originated 46,971 home mortgage loans[5] in the US in 2021. Just 1,036 of them included a Black applicant. This was 2.2% of KeyBank’s total originations, substantially less than other major lenders, where the share of loans to Black borrowers ranged from 2.9% to 20.8%.
Keybank also performs poorly across several other key categories in our analysis. It is tied for second-worst at lending to LMI neighborhoods (at 12%) and at lending to majority-minority neighborhoods (7%). It is also in a tie for third-worst bank in lending to people of color[6] (14%).
Click to sort the columns in the table below.
Methodology
This data is from the 2018-2021 Home Mortgage Disclosure Act (HMDA) dataset released by the Consumer Finance Protection Bureau (CFPB). Unless otherwise noted this report focuses on forward loan originations on site-built, 1-4 unit owner-occupied homes. This means reverse mortgages, loans on manufactured homes, multifamily lending, and second or investment homes are excluded. Originations refer to mortgage loan applications that resulted in a closed loan. The dataset illustrates that the mortgage industry as a whole is continuing to serve Black borrowers poorly – with KeyBank’s particularly poor performance serving as an outlier from these ugly broader trends. For more information on trends in mortgage lending in this dataset please see our report on 2018-2021 mortgage lending. For more information on how we identify Black mortgage applicants in HMDA data please see our white paper on that methodology.
We have also mapped KeyBank lending across several critical markets in this report. Depending on the metro area’s median black population percentage, two methods of clustering were used. The first method involved splitting all of the census tracts in a given metropolitan area into four evenly-sized quartiles based on the percentage of the tract’s residents who were Black compared with the median Black population at the tract level according to the 2022 FFIEC census file. This file uses 2020 Census boundaries and demographic data from the 2016-2020 ACS. Census tracts were then grouped into low, moderate, medium, and high Black quartiles, with an equal number of census tracts in each quartile. This method works best in cities with relatively small Black populations and produces a map of “Black” neighborhoods in a local context. The second method utilized a majority-Black sorting, where 50% or more Black residents would be considered a threshold to what defines a majority-Black neighborhood. Please contact the authors for a more detailed methodology.
Analysis
Socioeconomic Status and Access to Credit:
From 2018 to 2021 KeyBank loan applications from White homebuyers were more likely to wind up as originations than were applications from Black homebuyers. This disparity in origination rates is particularly egregious in the most recent data from 2021 and it appears regardless of borrower income. Upper-income borrowers report an income that is 120% or more than the median family income for their metro area while low- or moderate-income borrowers earn 80% or less of that figure. KeyBank was also more likely to deny loans to upper-income Black buyers than to lower-income White buyers. Loans that did not close for other reasons – for instance because the borrower went with another lender or did not find a home to purchase – had a similar pattern, as 24% of upper-income Black home applications did not close compared with just 17% of lower-income White home applications.
NCRC has shown that perceived socioeconomic status can be a factor in loan origination rates. While other lenders have also shown similar disparities, KeyBank has a particularly poor record of supporting Black homeownership. The most recent 2021 data shows KeyBank originated 67% of applications from LMI White applicants, compared with just 51% of LMI Black applicants and 59% of middle and upper income Black applicants. A similar trend is seen in denial rates: KeyBank is much more likely to deny loans to upper income Black applicants than lower income White applicants.
Tracking Access to Credit for LMI and Black Borrowers from 2018-2021:
The scatterplot below, tracks how KeyBank’s performance in lending to Black and LMI borrowers has failed to keep pace with the top bank lenders in its ten biggest markets. In most cases, lending to LMI and Black borrowers by KeyBank in those markets has declined as a share of its lending since it committed to increase support for the underserved. No city saw the substantial improvement the CBA was supposed to deliver. This visualization compares KeyBank with the top ten bank lenders in each market based on their share of loans to Black and LMI applicants.[7][8]
Home Purchase lending by KeyBank and the top ten banks across KeyBank’s top markets.
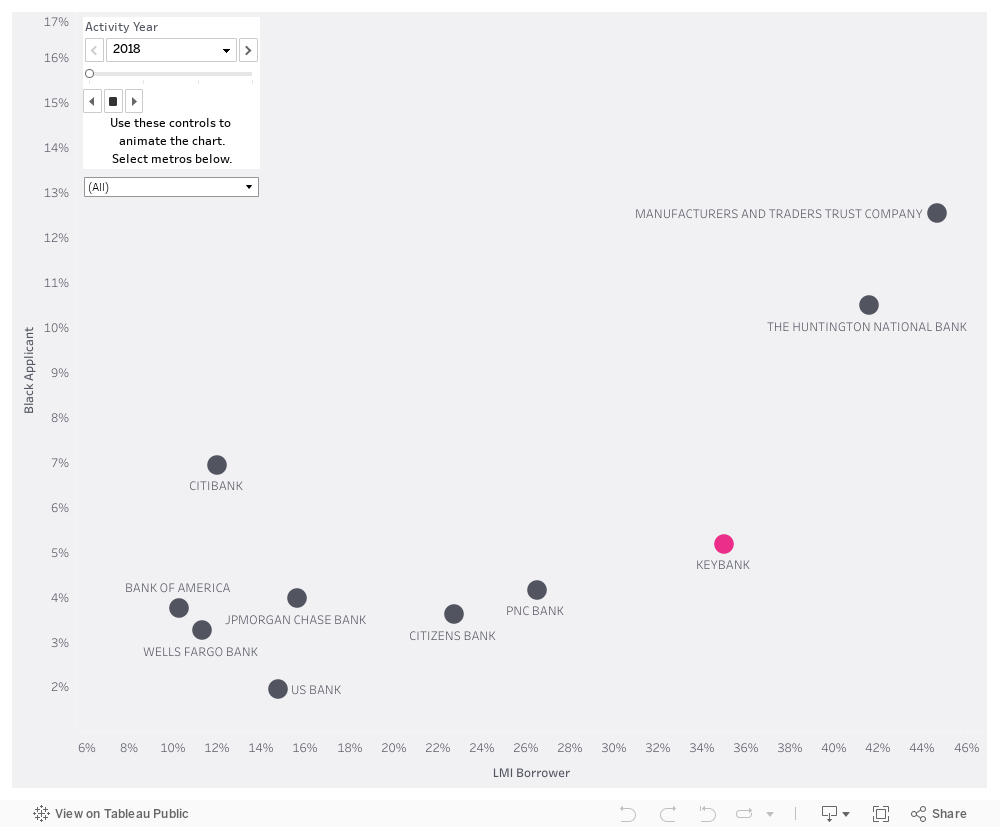
Caption: Lending in the ten metros where KeyBank reported the most originations in 2021. Originations from 2018-2021 of forward loans on owner occupied, site built 1-4 units homes. In each market KeyBank is shown in comparison to the top ten bank lenders in that market. If KeyBank is not among the top ten it is included as an eleventh bank.
It is perhaps most shocking that since 2018 – the first full year of data[9] following KeyBank’s formal commitment to increase lending to LMI borrowers – KeyBank has in fact done less lending to both LMI and Black borrowers with each passing year. This trend is visible in nearly all of the bank’s top markets. Across those markets it generally trails the top ten bank lenders in lending to LMI and Black borrowers in 2021.
Across 14 of the 20 markets where KeyBank reported the most originations in 2021, it trailed the rest of the top local banks in lending to Black borrowers. In six of those markets other banks’ share of loans to Black borrowers doubled that reported by KeyBank.
These markets include Buffalo, KeyBank’s second largest market since it acquired First Niagara. Other top banks in Buffalo were two and half times as likely to originate a loan to a Black borrower as KeyBank.
More concerning in some ways is the overall trend of KeyBank home purchase lending in these cities. Since 2018, KeyBank has reduced the share of its home purchase lending that goes to Black borrowers in 9 of its top 10 markets. KeyBank also reduced the share of its home purchase lending to LMI borrowers in these markets. This backslide in the demographic distribution of KeyBank’s work to promote homeownership contradicts the CBA’s intention to substantially increase lending to underserved borrowers and achieve peer leading performance. This stark failure cannot be attributed to external market trends: Other banks in these markets generally saw their home purchase lending to those communities improve or at least hold steady over the same time period. Even in cities like Pittsburgh, where KeyBank outperforms the market in loans to Black borrowers, it reported an 11 percentage point drop in loans to Black borrowers from 2018 to 2021 while the other top bank lenders there increased their lending by six percentage points.
KeyBank is moving in the wrong direction for loans to Black borrowers as well. Across 7 of the bank’s top 10 markets it reported that the share of its loans going to a Black borrower fell from 2018 to 2021.
Overall, KeyBank reported an 18 percentage point decline in home purchase loans with an LMI borrower, declining by half, from 35% of its 2018 home purchase loans to just 17% by 2021. The share of those loans going to a Black borrower fell by nearly half as well, from 5.2% of 2018 home purchases to 2.7% in 2021. Meanwhile, the other top banks in those markets increased their LMI lending by 3 percentage points and loans to Black borrowers by 1 percentage point.
Analysis by Marketplace:
Mapping of KeyBank’s 2021 lending across several of the top markets reveals that it consistently avoids lending in Black neighborhoods. This pattern stands in stark contrast to KeyBank’s public commitment to increase investment in underserved communities. This is classic redlining. In every major market where KeyBank operates, NCRC identified a minimal amount of lending in neighborhoods where Black residents are concentrated.
A review of KeyBank’s lending in selected markets, outlined below, shows stark examples of KeyBank’s failure to deliver the support it promised to underserved communities. In fact, in these cities the share of KeyBank loans going to Black and LMI borrowers actually decreased following its merger with First Niagara.
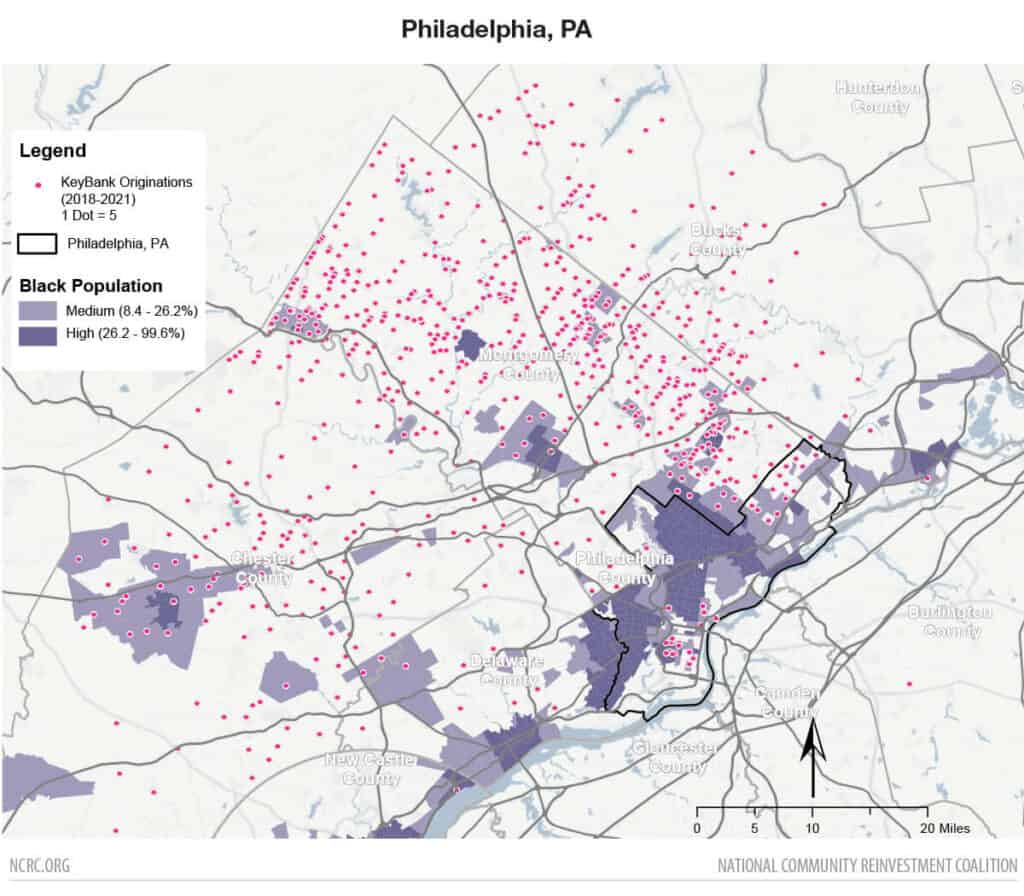
Philadelphia, PA:
KeyBank’s seventh largest market, Philadelphia, is perhaps the starkest example of its failure to serve Black mortgage borrowers. One in five Philadelphia metro area residents is Black[10], yet just one in 45 KeyBank mortgage loans went to a Black borrower in 2021. Keybank reported making 1,225 loans to borrowers in the Philadelphia metro that year, and just 27 of them – 2.2% – involved a Black borrower. Other top banks reported that 8.2% of their mortgage loans were with a Black borrower. Again, the home purchase lending of KeyBank is of particular concern. Of 155 Philadelphia home purchase loans in 2021 just 2, or 1.3%, were with a Black borrower. This was a substantial decline from 2018, when 4.1% of KeyBank home purchase loans in Philadelphia were with a Black buyer. Other top banks in the city made 14.4% of their home purchases to a Black borrower that same year. Other banks are 11 times as likely to make a home purchase loan to a Black home buyer in Philadelphia than KeyBank. Between 2018 and 2021 KeyBank reduced the share of its loans in Philadelphia to LMI borrowers by 16 percentage points. Other banks in the metro area increased home purchase lending to LMI borrowers by 6 percentage points over the same period. The same is true when looking specifically at Black home purchase lending in Philadelphia: KeyBank’s declined by 3 percent while other banks increased their share of lending to Black borrowers by 4 percentage points.
In addition to performing poorly in lending to Black borrowers, KeyBank generally avoids lending to any neighborhood in the Philadelphia metropolitan area which has a high concentration of Black residents relative to the median Black population in this metro.
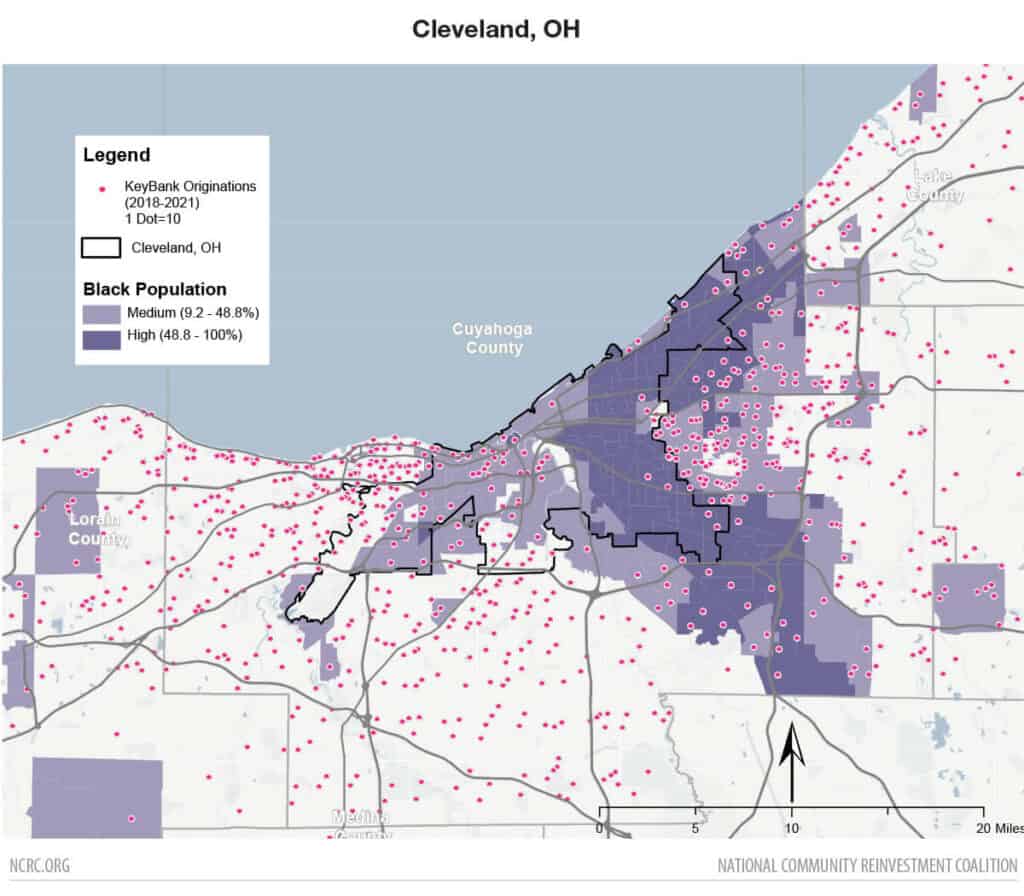
Cleveland, OH:
Cleveland, where KeyBank is headquartered, was the bank’s third largest market in 2021, with 3,047 loan originations. Here, KeyBank performs better than in many other metros, reporting that 6% of its loans went to a Black applicant, compared with 4.4% among the other top banks in this market.
But even in Cleveland – a market where KeyBank outperforms several local competitors in lending to Black home purchase loan applicants – KeyBank is backtracking from the inclusion and equity efforts it signaled when it signed the CBA. Since 2018 KeyBank has exceeded the average percent of lending to Black borrowers by the rest of the top ten banks. However, the trendlines from 2018 through 2021 tell a different story. KeyBank is falling towards the back of the pack rather than acting as a leader in driving up homeownership opportunities for the 19% of Cleveland residents who are Black. From 2018 to 2021 KeyBank lending to Black homebuyers fell by one percentage point as other banks increased their share by one percentage point. This is a small but meaningful reflection of KeyBank’s overall trends; everywhere we look they are moving in the wrong direction. KeyBank did increase its share of lending to LMI home purchasers over those years, but at a slower clip than its local competitors: KeyBank’s LMI share rose 2 percentage points while Cleveland’s nine other largest banks increased LMI home purchase lending share by 3 percentage points.
It becomes even clearer that Cleveland is not a success story for KeyBank when its home purchase loan activity is analyzed geographically. As the map below reveals, KeyBank avoids lending in neighborhoods where the Black population share exceeds 48.8 percent (i.e. neighborhoods in the highest quartile of Black population share for the city in our data). In those communities, Keybank engages in little to no lending.
Cleveland is not alone in this pattern of geotargeted neglect. As maps further down in this report show, KeyBank ignores the credit needs of Black neighborhoods even in cities where it performs comparably to other bank lenders in loans to individual Black borrowers.
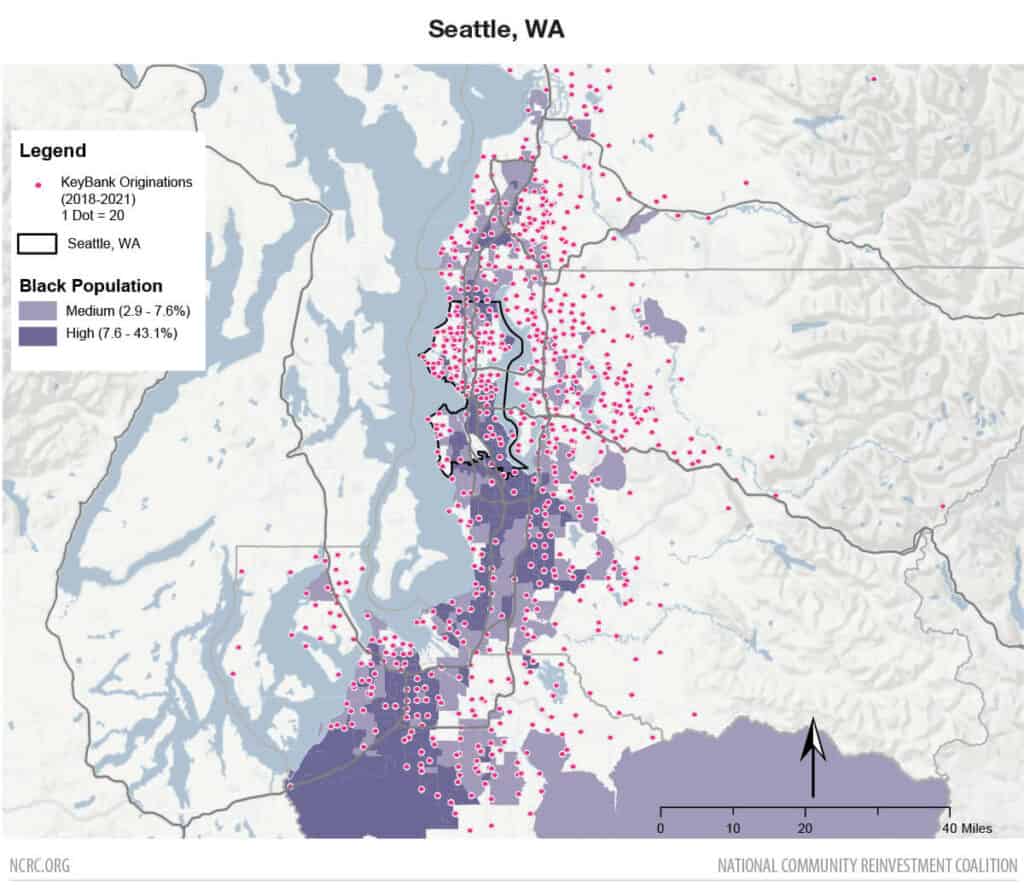
Seattle, WA:
The largest market for KeyBank was Seattle, where it made 6,032 loans in 2021. Of those loans in Seattle, just 83 went to a Black applicant. Black residents comprise 6% of the total Seattle population, yet just 1.4% of KeyBank’s loans went to a Black borrower in 2021. As bad as that number is, it actually understates KeyBank’s failures in boosting Black homeownership. Roughly one-third of KeyBank’s 2021 home mortgage loans in Seattle were loans for the purchase of a home. Just 8 of the 2,184 home purchase loans KeyBank made in Seattle were made to a Black borrower. At 0.4% this falls far short of other Seattle banks, who made 1.8% of their home purchase loans to Black borrowers that year. In comparison, other bank lenders are over four times as likely as KeyBank to make a loan to a Black borrower to purchase a home.
This great disparity between KeyBank and other banks did not always exist. In 2018 KeyBank made just 226 home purchase loans in the Seattle metro area, 3 of which were made to Black borrowers. At 1.3% of its loans this placed KeyBank on par with the other large banks. In 2021 KeyBank made 2,184 home purchase loans, a tenfold increase over four years. Yet, it originated just 8 loans that year to a Black homebuyer – placing them firmly in last place among other top banks.
In Seattle in 2018, KeyBank made 27% of its home purchase loans to an LMI applicant, far ahead of other top bank lenders in this market. By 2021 the share of those loans to an LMI borrower plummeted to just 4% of the bank’s lending – a 23 percentage point decrease. In just 3 years, KeyBank went from first to worst among Seattle’s top banks. This means that KeyBank made a concerted effort to generate new home purchase lending revenue in Seattle in general – but did so by focusing on wealthier White borrowers, at the expense of the LMI customers it had agreed to better serve. The rest of the banks making home purchase loans in Seattle saw no such decline.
Seattle has a low percentage of Black residents compared with other KeyBank markets. However, in neighborhoods where the Black population is higher there is a further division visible when we map KeyBank lending. Areas with higher Black populations that are adjacent to communities with few Black residents see a substantially higher number of KeyBank loans than in Black neighborhoods that are surrounded by other Black census tracts. As we have noted in our reports on gentrification, part of that process is an influx of new residents that displace the incumbent population. KeyBank makes very few loans to Black borrowers, indicating that most of the loans it makes in Black neighborhoods are not going to Black borrowers. If KeyBank is providing credit to non-Black borrowers for homes in Black communities while denying Black borrowers the same option, that process could drive gentrification and displacement.
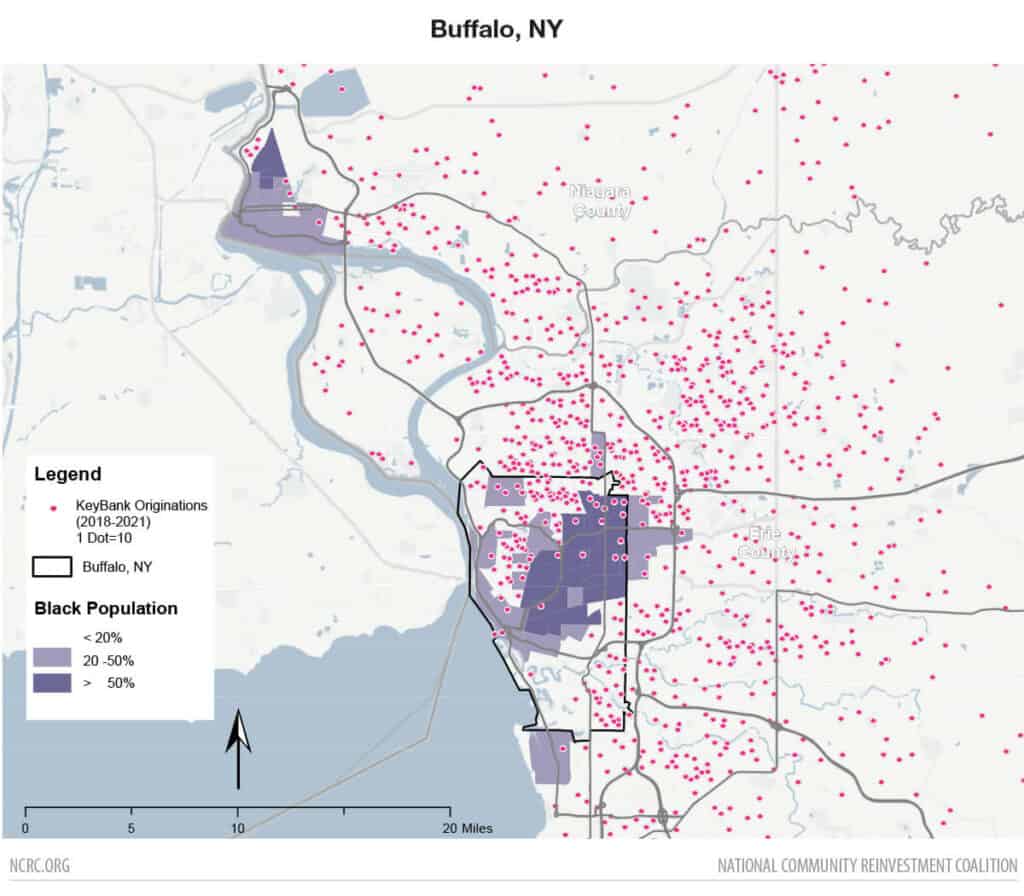
Buffalo, NY:
KeyBank’s merger with First Niagara dramatically increased its footprint in Buffalo, which was KeyBank’s second largest market in 2021, with 3,375 loan originations. The city perhaps most affected by that merger is also among those most betrayed by KeyBank’s failure to live up to the CBA.
The Buffalo metro is 11% Black, yet Black borrowers got a mortgage loan from KeyBank just 65 times that year, accounting for just 1.9% of the bank’s total production there. Other top banks made 4.6% of their loans to a Black borrower. As in Seattle, KeyBank’s home purchase lending to Black applicants is even worse. Of 652 home purchase loans to the Buffalo area in 2021, just 14 (2.1%) had a Black borrower. Other banks made 8.3% of their home purchase loans to Black home buyers that same year, near four times the rate of KeyBank. Between 2018 and 2021 both KeyBank and the other banks in the Buffalo market saw the share of loans to LMI home buyers decline. The share of KeyBank’s home purchase loans to an LMI borrower fell from 38% to 32% in that timeframe, a decline of six percentage points. Other banks reported just a four percentage point drop, from 48% to 44% of all loans. Not only does KeyBank continue to trail other banks in LMI lending in Buffalo, it has fallen further behind since signing a CBA committing it to better support underserved residents. Other banks increased their lending to Black home buyers during this period by four percentage points. KeyBank made the opposite business choice, reducing purchase loans to Black homebuyers by two percentage points from 2018 to 2021.
KeyBank’s lending patterns in Buffalo show severe indications of redlining. In neighborhoods with higher Black populations there is almost no evidence of lending by KeyBank.
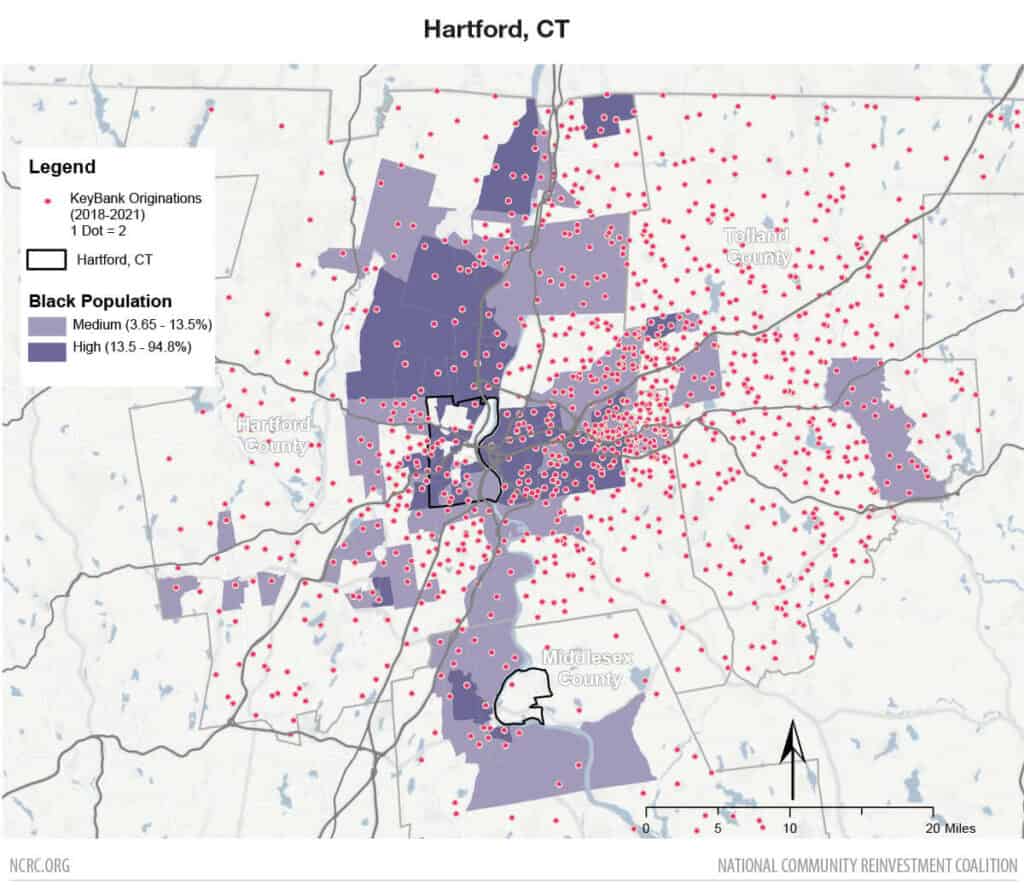
Hartford, CT:
Hartford, CT provides another bleak example of KeyBank’s lending to Black borrowers. Black residents comprise 11% of the Hartford population. KeyBank made 819 home mortgage loans there in 2021. Of those originations, just 15 – 1.8% – had a Black borrower. Other bank lenders reported 4.5% of their loans involved a Black borrower. Here as in other cities, KeyBank’s performance is even worse when isolating loans for home purchases from other types of mortgage lending. KeyBank financed 133 home purchases in Hartford in 2021, only one (0.8% of its total home purchase lending) had a Black borrower. By comparison, other banks made 8.2% of their home purchase loans to Black borrowers that same year, ten times the rate of KeyBank’s lending.
Mapping KeyBank lending across Hartford shows a substantial number of loans in neighborhoods that have high concentrations of Black residents. However, as so few of KeyBank’s loans are made to Black borrowers, it appears that most loans made by KeyBank in Black neighborhoods do not go to a Black borrower.
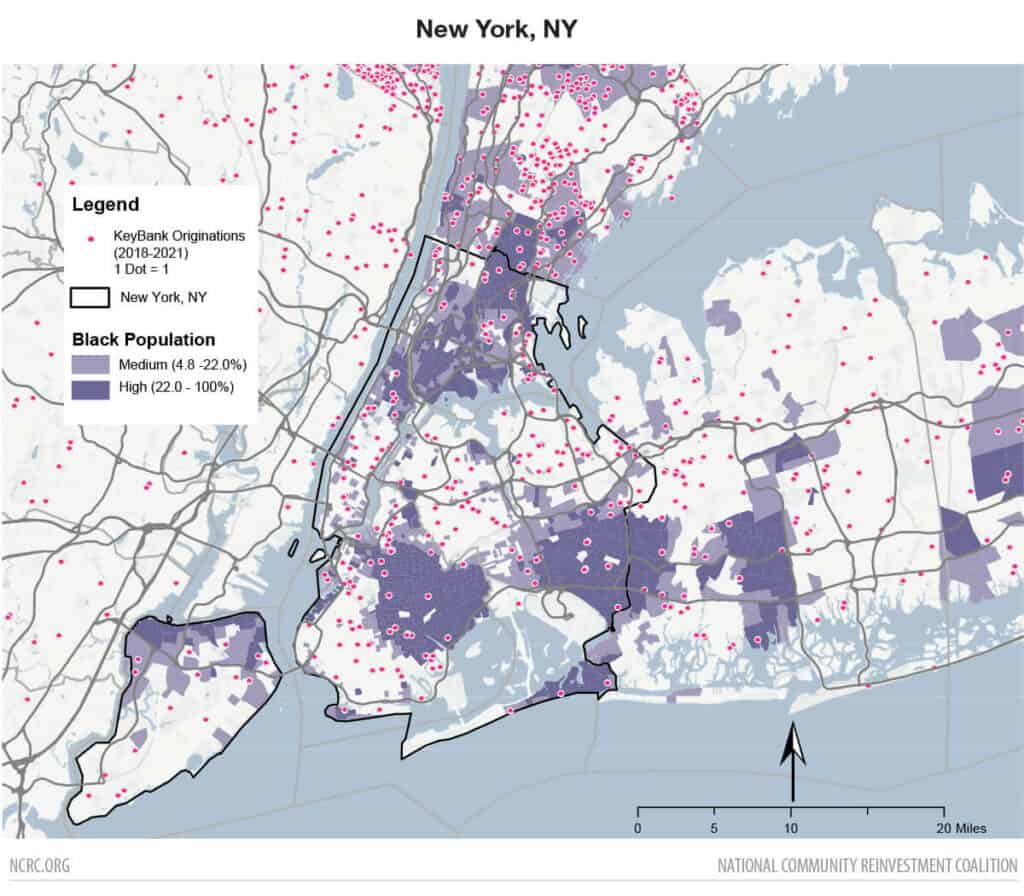
New York, NY:
The New York area provides another example of how KeyBank performs similarly to other bank lenders in the number of loans to Black borrowers while at the same time avoiding loans in neighborhoods where Black families are more prevalent. As in other markets where KeyBank performs well in comparison to other banks, KeyBank’s lending trend since 2018 is cause for concern. KeyBank made 17% of its home purchase loans to an LMI borrower and 9.3% to a Black borrower in the New York metro area during 2018. By 2021, those figures fell to 8% and 6% respectively while other banks increased their share of their home purchase lending to LMI and Black home buyers.
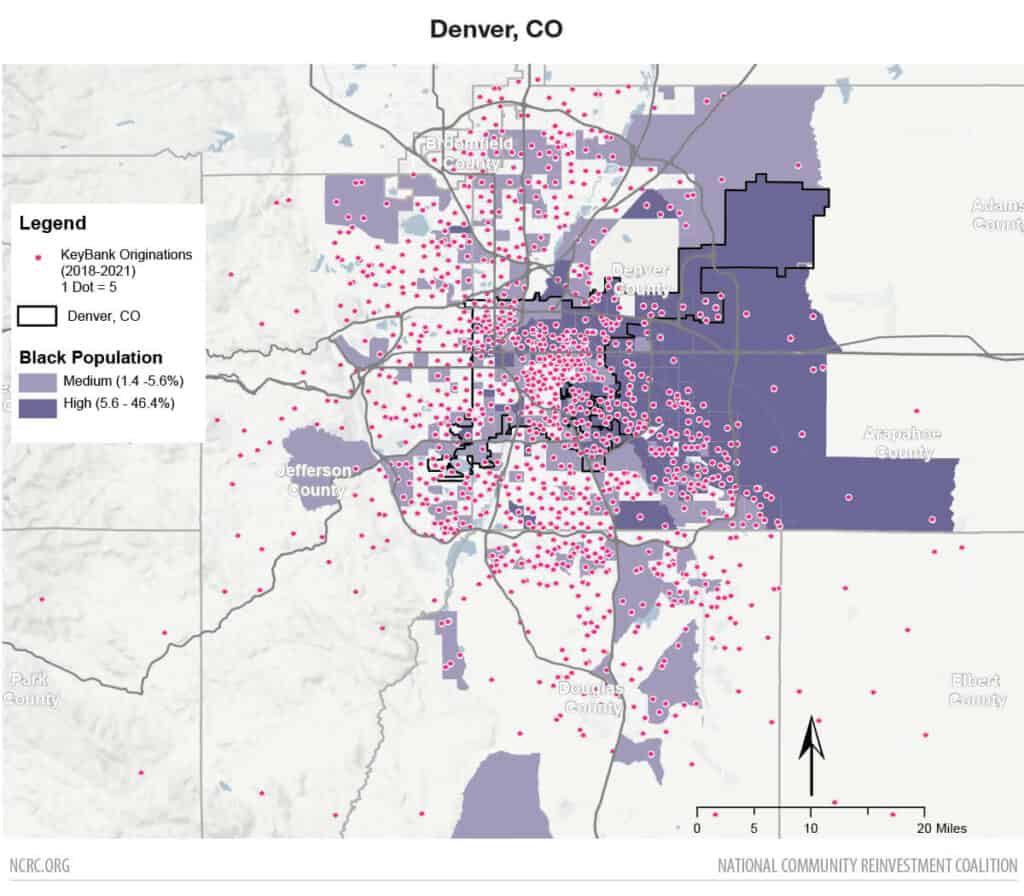
Denver, CO:
In 2021, KeyBank originated 1,901 loans in Denver which made Denver its fifth largest market. Black residents account for just 5% of the Denver metro area population, yet 3% of loans made by bank lenders other than KeyBank had a Black applicant in 2021. Here, although data shows KeyBank did somewhat better than in its other major markets, only 2.2% of its loans went to Black borrowers.
However, KeyBank’s home purchase lending in Denver is cause for particular concern. Of the 442 home purchase loans made by KeyBank in 2021, just 7 include a Black applicant. This is just 1.6% of its home purchase lending. As in New York, KeyBank’s trend since 2018 in Denver is sharply downward, with a 10.1 percentage point decline in lending to LMI borrowers by 2021. The bank’s lending to Black borrowers is headed in the wrong direction as well, falling by about half from 3.3% to 1.6% over that timeframe.
When we map KeyBank’s loan activity in Denver we see that it makes a substantial number of its loans to areas where the Black population is relatively high. Yet, data indicates it is not lending to Black people in those neighborhoods. Instead, KeyBank is facilitating other demographic groups’ purchases of homes in Black communities. KeyBank is lending in “Black neighborhoods” without lending to Black residents within them – thus contributing to the displacement of LMI communities writ large. In 2020, NCRC reported that Denver was the second most intensely gentrifying city in the country. When banks fail to serve Black and LMI communities they indirectly support redlining by starving those communities of capital.
Conclusion
These metros offer a snapshot of KeyBank’s poor performance in lending to underserved communities in the US in 2021, years after publicly committing to increase the bank’s support for underserved populations affected by a proposed merger that helped the bank make more money. KeyBank not only failed to increase its share of lending to LMI borrowers, in many cases, it also sharply lowered the share of its home purchase lending that went to LMI and Black borrowers, leaving the bank far behind other top banks in its biggest markets. KeyBank won regulatory approval for a merger that it claimed would benefit underserved communities in affected markets – then focused on wealthier White borrowers and neighborhoods as it aggressively expanded its overall home mortgage line of business.
While there are some markets where KeyBank’s performance was on par with other lenders, the overwhelming majority of its lending shows extremely low levels of lending to Black borrowers. Even in communities where KeyBank’s share of loans to Black borrowers was similar to other lenders, KeyBank repeatedly failed to lend in Black neighborhoods. This stark example of modern redlining is troubling – especially in light of statements KeyBank made about how it would serve marginalized communities if it was allowed to absorb a competing bank.
[1]Office of the Comptroller of the Currency, CRA Decision #177, October 2016, available at https://www.occ.gov/topics/charters-and-licensing/interpretations-and-actions/2016/crad177.pdf
[2] KeyBank 2017 National Community Benefits Plan, March 17 2016
[3] KeyBank 2018 Annual Report, available at https://www.annualreports.com/HostedData/AnnualReportArchive/k/NYSE_KEY_2018.pdf
[4] In this report we discuss KeyBank’s lending in comparison to both other banks as well as all lenders. All lenders include banks, mortgage companies and credit unions.
[5] Defined as forward loans on owner-occupied, 1-4 unit site-built home loans.
[6] Defined as a borrower that identified themselves by race or ethnicity and is not a non-Hispanic White.
[7] Throughout this report when looking at individual metros we compare KeyBank with the top ten banks in terms of 2021 originations in that metro. In cases where KeyBank is among the top ten they are compared to the other nine largest bank lenders in that market.
[8] The annual HMDA lender file produced by Robert Avery of FHFA is used to determine lender type. Contact the author for more information.
[9] Changes to how HMDA data is collected in 2018 makes it difficult to directly compare data between modern and legacy (pre-2018) data.
[10] The Philadelphia-Camden-Wilmington, PA-NJ-DE-MD Metro Area is 19% Black as of ACS 2021 1-year. Unless otherwise noted, this is the source for CBSA demographic data throughout this report.
