
Introduction
The Community Reinvestment Act (CRA) is an income-based law. Accordingly, the regulations and exams focus on evaluating bank lending, investing and services to low- and moderate-income (LMI) borrowers and tracts. However, one of the major motivations prompting the passage of CRA in 1977 was reversing redlining and disinvestment from minority as well as working class neighborhoods. Community advocates and local public sector officials testified during the hearings before the vote on CRA that redlining was pervasive in communities of color.[1]
Over the years, the National Community Reinvestment Coalition (NCRC) and our members have advocated for the inclusion of race on CRA exams since people of color and communities of color continue to experience a shortage of affordably priced banking products and a disproportionate amount of high-cost and abusive products. The financial crisis stemmed in large part from abusive lenders targeting communities of color that were starved of mainstream banking products.[2] Currently, communities of color still encounter shortages of loans.
The federal bank agencies have not added race as an explicit part of CRA exams, maintaining that Congress would need to amend the statute in order to allow the agencies to do so. CRA exams indirectly address racial disparities in lending with an accompanying fair lending review that is designed to ensure that banks are not engaging in discrimination based on race or other prohibited classes. The public information in the fair lending review on CRA exams has been cursory and has usually consisted of a few sentences stating that no discrimination was found.
In addition to the fair lending review, exams ensure that there are no “conspicuous gaps” in lending activity. Examiners scrutinize lending data to make sure that groupings of contiguous census tracts that are in the bank’s service area are not arbitrarily excluded from a bank’s lending activity.[3] If examiners detect gaps and possible redlining, they refer cases to the Department of Justice, which has resulted in redlining settlements over the years.
While conspicuous gap analysis is a commendable aspect of CRA exams, it is not a comprehensive overview of lending in communities of color, which means it cannot spot overall low lending levels in communities of color. Some CRA exams look at “economically disadvantaged areas.” While this could be the start of a more systematic analysis of lending and service in communities with chronically low levels of lending, it is generally not a well-developed analysis. Exams occasionally have a few short paragraphs describing the numbers of loans in low-income tracts or distressed/underserved middle-income rural tracts which seems to be a proxy for economically disadvantaged areas.[4]
The lending shortfalls facing communities of color and other underserved communities have received increased attention over the years. These issues made their way into the Office of the Comptroller of the Currency’s (OCC’s) Advanced Notice of Proposed Rulemaking (ANPR) issued in September 2018. The OCC included a question of whether community development activities should receive consideration if they benefited “specified underserved populations or areas.”[5] NCRC responded to this question by suggesting that the agencies identify census tracts that exhibit low levels of lending. NCRC surmised that a high number of these tracts would be communities of color and many, but not all of these tracts, would be LMI. Then CRA exams could scrutinize activity in these underserved tracts, not only evaluating the level of community development activity but also lending and basic banking services.
Another benefit of adding underserved tracts on CRA exams would be to relieve pressure on LMI tracts that are gentrifying. Gentrification, typified by an influx of middle- and upper-income people into a neighborhood, can be accompanied by displacement of longer-term residents that are people of color or lower-income. Gentrification is most intense on the East and West coasts but is increasing in other parts of the country.[6] Banks can sometimes find it too easy to satisfy their requirements to lend in LMI areas by focusing on gentrifying neighborhoods. Carolina Reid, for example, documents that more than 90% of the lending in LMI neighborhoods in San Francisco is for middle- and upper-income people.[7] If CRA exams added a criteria of lending to and service in underserved tracts, some of this overheated market activity would be diverted from gentrifying LMI tracts and would be channeled to underserved tracts that need more lending.
This analysis discusses whether the concept of identifying underserved tracts would be helpful in increasing banking, investments and services to communities of color and whether it would ease the market pressures on rapidly gentrifying LMI tracts.
Methodology
NCRC used Core Based Statistical Areas (CBSAs) as the unit of geography in which to conduct the census tract analysis. CBSAs are urban areas with populations greater than 10,000. These are broken down into two types of MSAs: Micropolitan Statistical Area (population 10,000 -50,000) and Metropolitan Statistical Areas (population greater than 50,000).
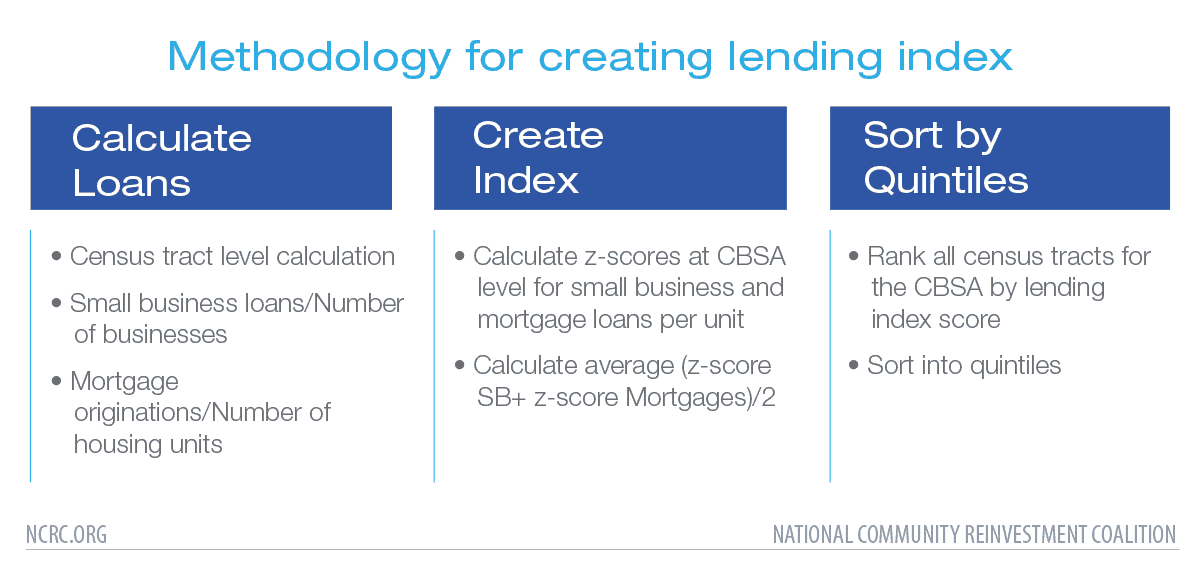
NCRC created a lending index by categorizing census tracts based on levels of lending activity. Specifically, NCRC calculated home loans per housing units and small business loans per operating businesses. The resulting values of mortgages and small business loans were then standardized at the Core Based Statistical Area (CBSA) level utilizing z-scores. A simple average of z-scores combined the two measures in an index score for each tract. Census tracts for each CBSA were then ranked by the combined lending index and sorted into quintiles. NCRC used the most recent year for both the Home Mortgage Disclosure Act (HMDA) and CRA small business loan data, which was 2017. Additional data is described in a table in the appendix.
Results
NCRC calculated quintiles of census tracts based on levels of lending activity for all CBSAs in the nation. We also focused on two CBSAs; the Washington, D.C., MSA and Milwaukee MSA; since these two are from different regions of the country and have distinct economic and demographic characteristics.
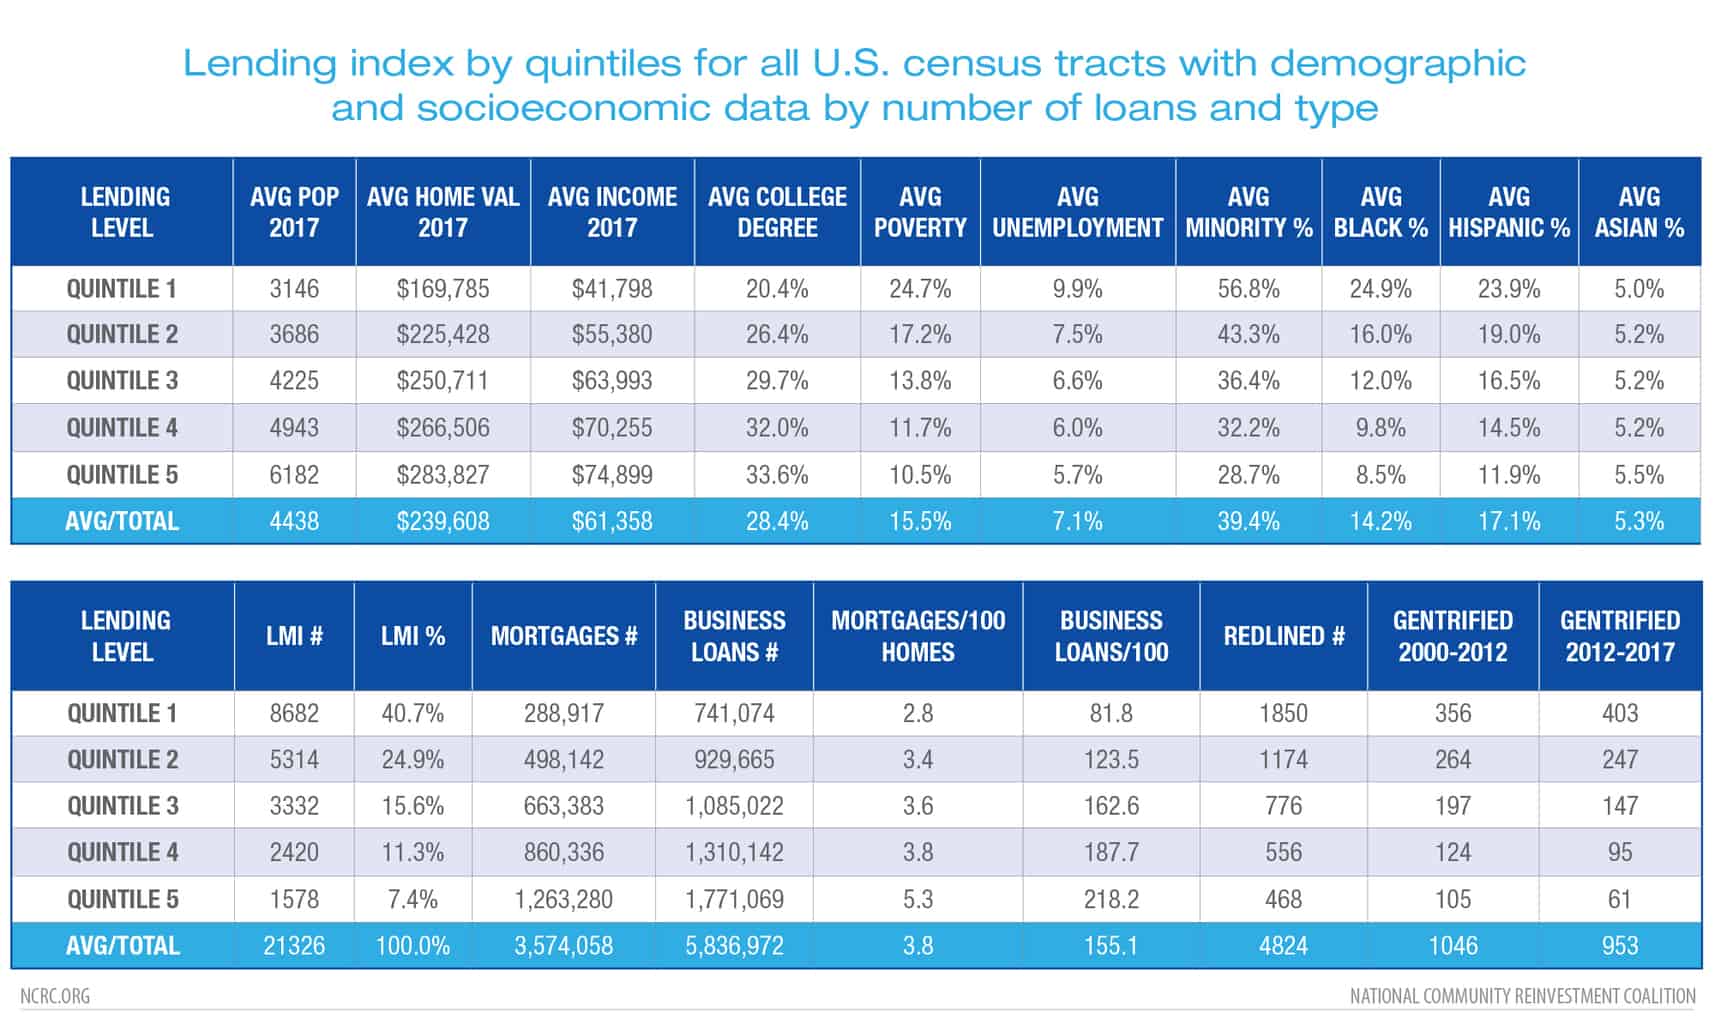
On a national level, the concept of dividing census tracts into quintiles based on lending activity levels appeared to achieve the objective of identifying underserved census tracts that merit more attention on CRA exams. Quintile 1 tracts, which had the lowest level of lending, had an average of 2.8 home loans per 100 housing units. In contrast, Quintile 5 tracts, which had the highest level of lending, had an average of 5.3 loans per 100 housing units.
The results for small business lending were even more pronounced. Quintile 1 had almost 82 small business loans per 100 businesses while Quintile 5 had 218 small business loans per 100 businesses(as shown below in the tables in the appendix).
It may appear unusual that there were more small business loans than there were small businesses in all the quintiles except Quintile 1. The CRA small business loan data includes data on credit card lending, which significantly increases the volume of lending. Credit card lending is higher cost than non-credit card lending and usually of much lower amounts, averaging $10,000 or less. Researchers do not have the ability to separate credit card from non-credit card lending from the CRA small business loan data. Hence, the loans per small business often appear high. Nevertheless, it still revealed significant differences in access to lending across groups of census tracts.
The lower lending levels in Quintiles 1 and 2 corresponded to historical patterns of redlining. In a report last year, NCRC applied the Federal Home Owners’ Loan Corporation (HOLC) 1930s’ classifications of so-called definitely declining or hazardous neighborhoods to census tracts.[8] These two lowest classifications often corresponded to communities of color and neighborhoods with recent immigrants. As NCRC found last year, these pernicious characterizations continue to have lingering impacts. This exercise reconfirmed the harmful impact of the HOLC characterizations. Quintiles 1 and 2 had the highest numbers of redlined tracts (definitely declining or hazardous) at 1,850 tracts and 1,174 tracts, respectively. Quintiles 4 and 5 had 556 and 468 tracts, respectively, that were redlined. Tracts in Quintiles 4 and 5 were more successful in combating the stigma of an unfortunate HOLC classification and climbing economically. Since fewer of them had low HOLC classifications and they were most likely contiguous, it was probably easier for these communities to advance economically.
Tracts with lower levels of lending activity corresponded to communities of color. Tracts in Quintile 1 were, on average, 56.8% minority and tracts in Quintile 2 were on average, 43.3% minority. In contrast, tracts in Quintile 4 were, on average, 32.2% minority and tracts in Quintile 5 were, on average, 28.7% minority. The average percentage of African Americans and Hispanics were much higher in Quintiles 1 and 2 than in Quintiles 4 and 5. In contrast, the percentage of Asians was similar across all quintiles.
Average income levels were also significantly different across tract quintiles. The average income in Quintile 1 and 2 was $41,798 and $55,380, respectively. In contrast, the average tract income in Quintile 5 was almost twice as high as Quintile 1 at $74,899. Likewise, the average poverty rate was more than twice as high in Quintile 1 (24.7%) than Quintile 5 (10.5%). Unemployment rates were also consistent with this pattern; average tract unemployment in Quintile 1 was 9.9%, almost twice the average tract rate of 5.7% in Quintile 5.
Additional socio-economic indicators also favored Quintiles 4 and 5. The average tract percentage of people with college degrees was between 32% and 33% in Quintiles 4 and 5. In Quintile 1, it was just 20.4% and in Quintile 2, it was 26.4%. Similarly, average tract home values were about $266,000 and $283,000 in Quintiles 4 and 5, respectively. It was much lower in Quintile 1 at about $170,000.
Most of the LMI tracts were in Quintiles 1 and 2, but the percentage of tracts that were LMI in both of these quintiles was less than 50%. Forty percent of the tracts in Quintile 1 were LMI and 24.9% of the tracts in Quintile 2 were LMI. On the other end of the spectrum, 11.3% and 7.4% of the tracts in Quintiles 4 and 5, respectively, were LMI (how these LMI tracts had higher lending levels than tracts in Quintiles 1 and 2 is an important question for future research).
Most pertinent for our purposes is that this exercise has shown that it is possible and desirable to classify tracts by lending levels into quintiles and to further categorize the quintiles of tracts by demographic and economic characteristics. The exercise has identified not only LMI tracts but a significant number of non-LMI tracts that are majority people of color. A significant number of tracts, particularly in Quintile 1, were economically distressed with high levels of poverty and unemployment in addition to low levels of lending. It would seem that including a criterion of underserved tracts on the current lending, investment and service tests of CRA exams would help target CRA activity to tracts in need of it.
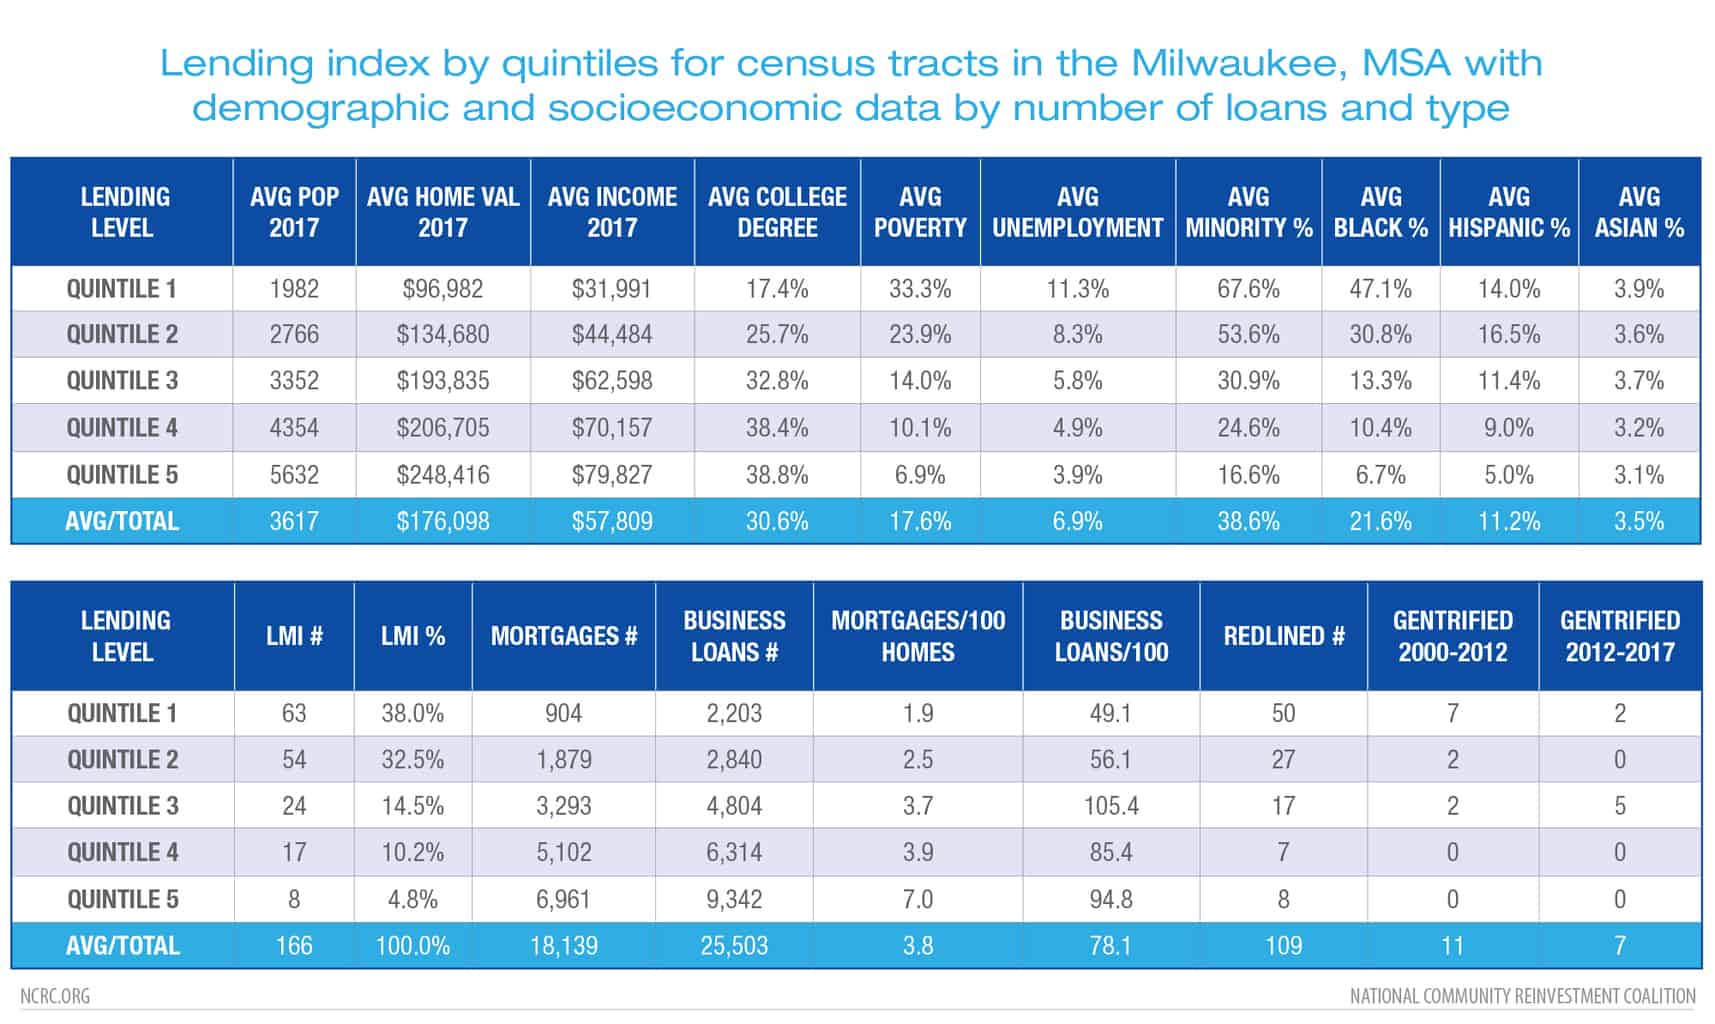
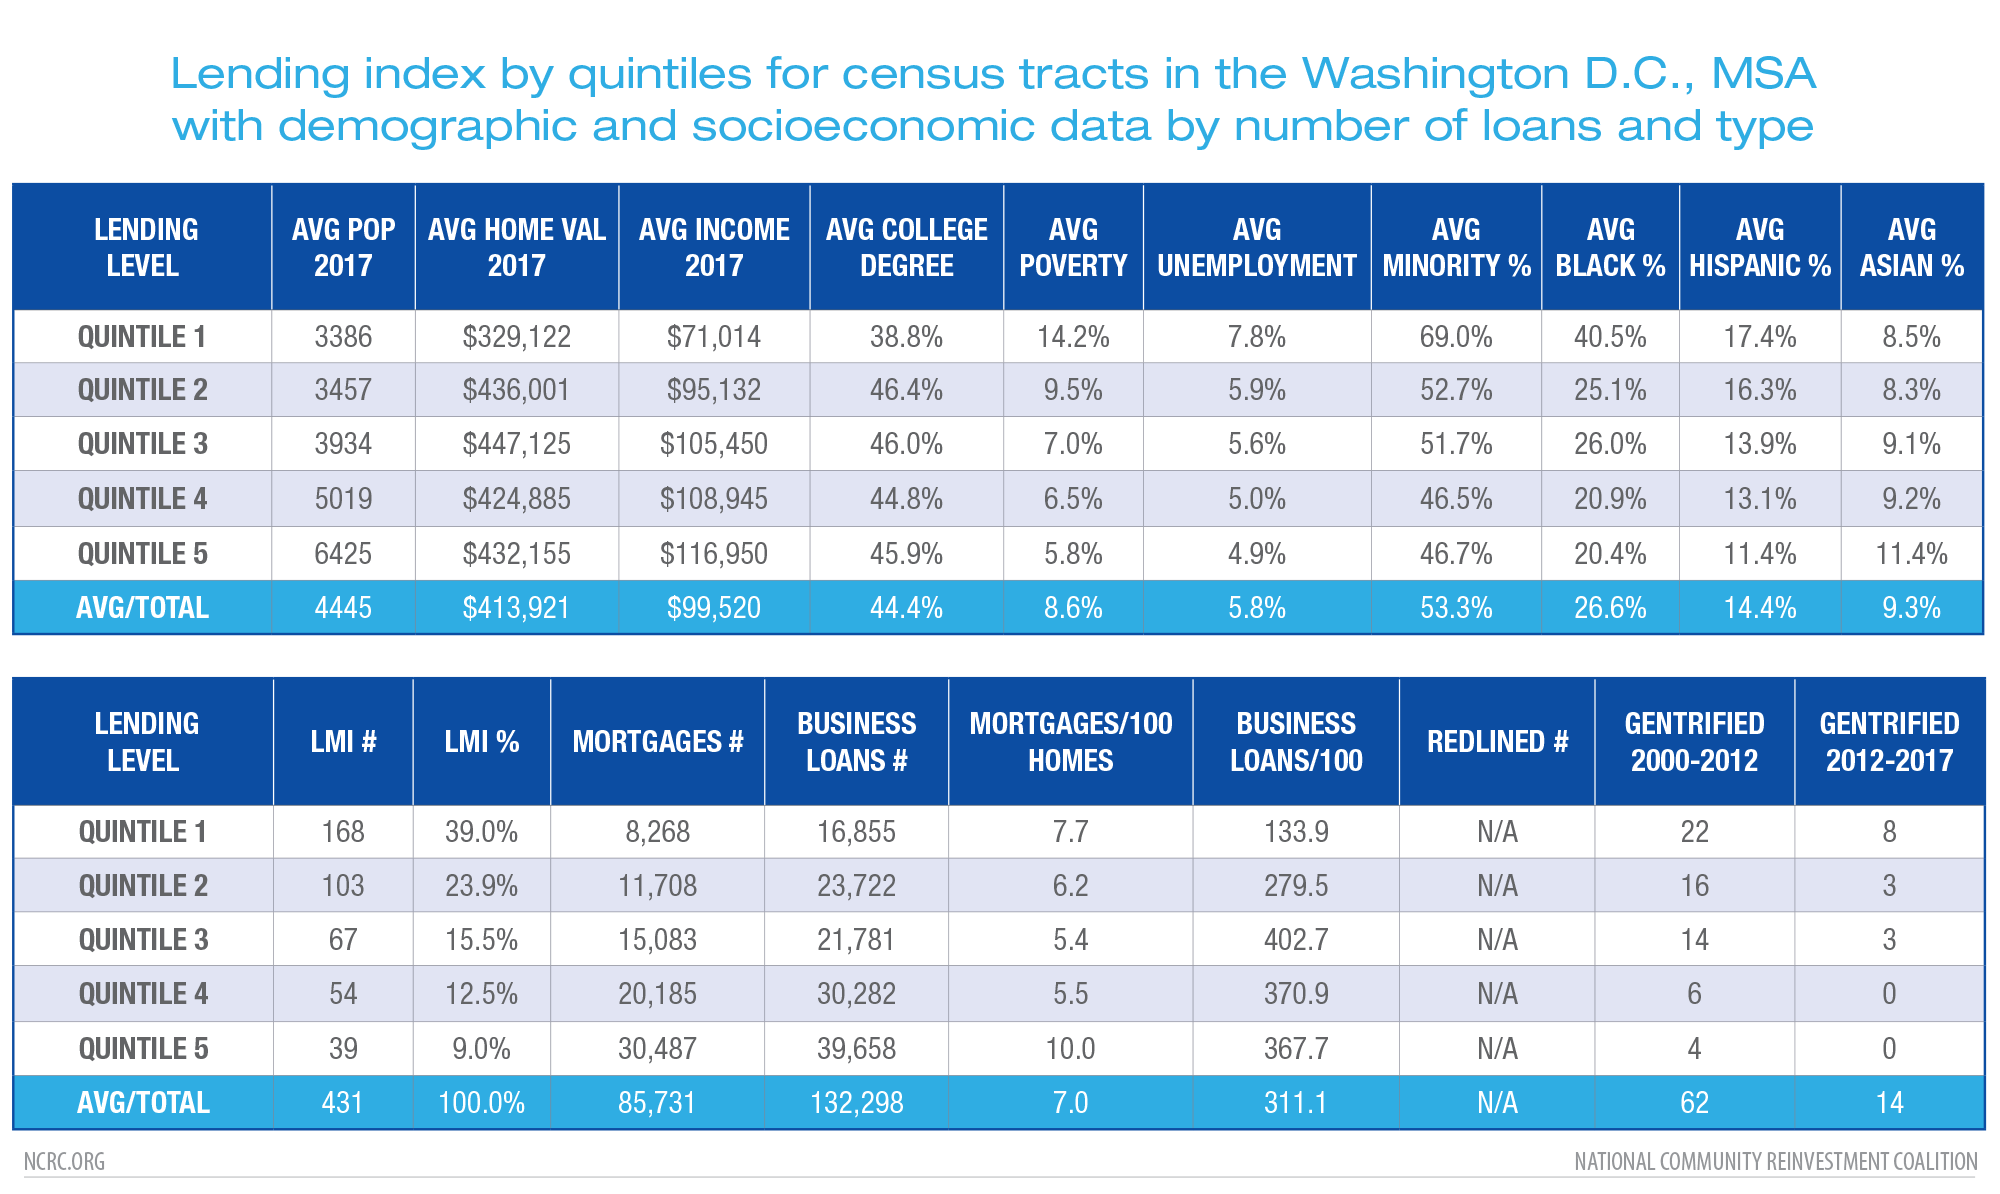
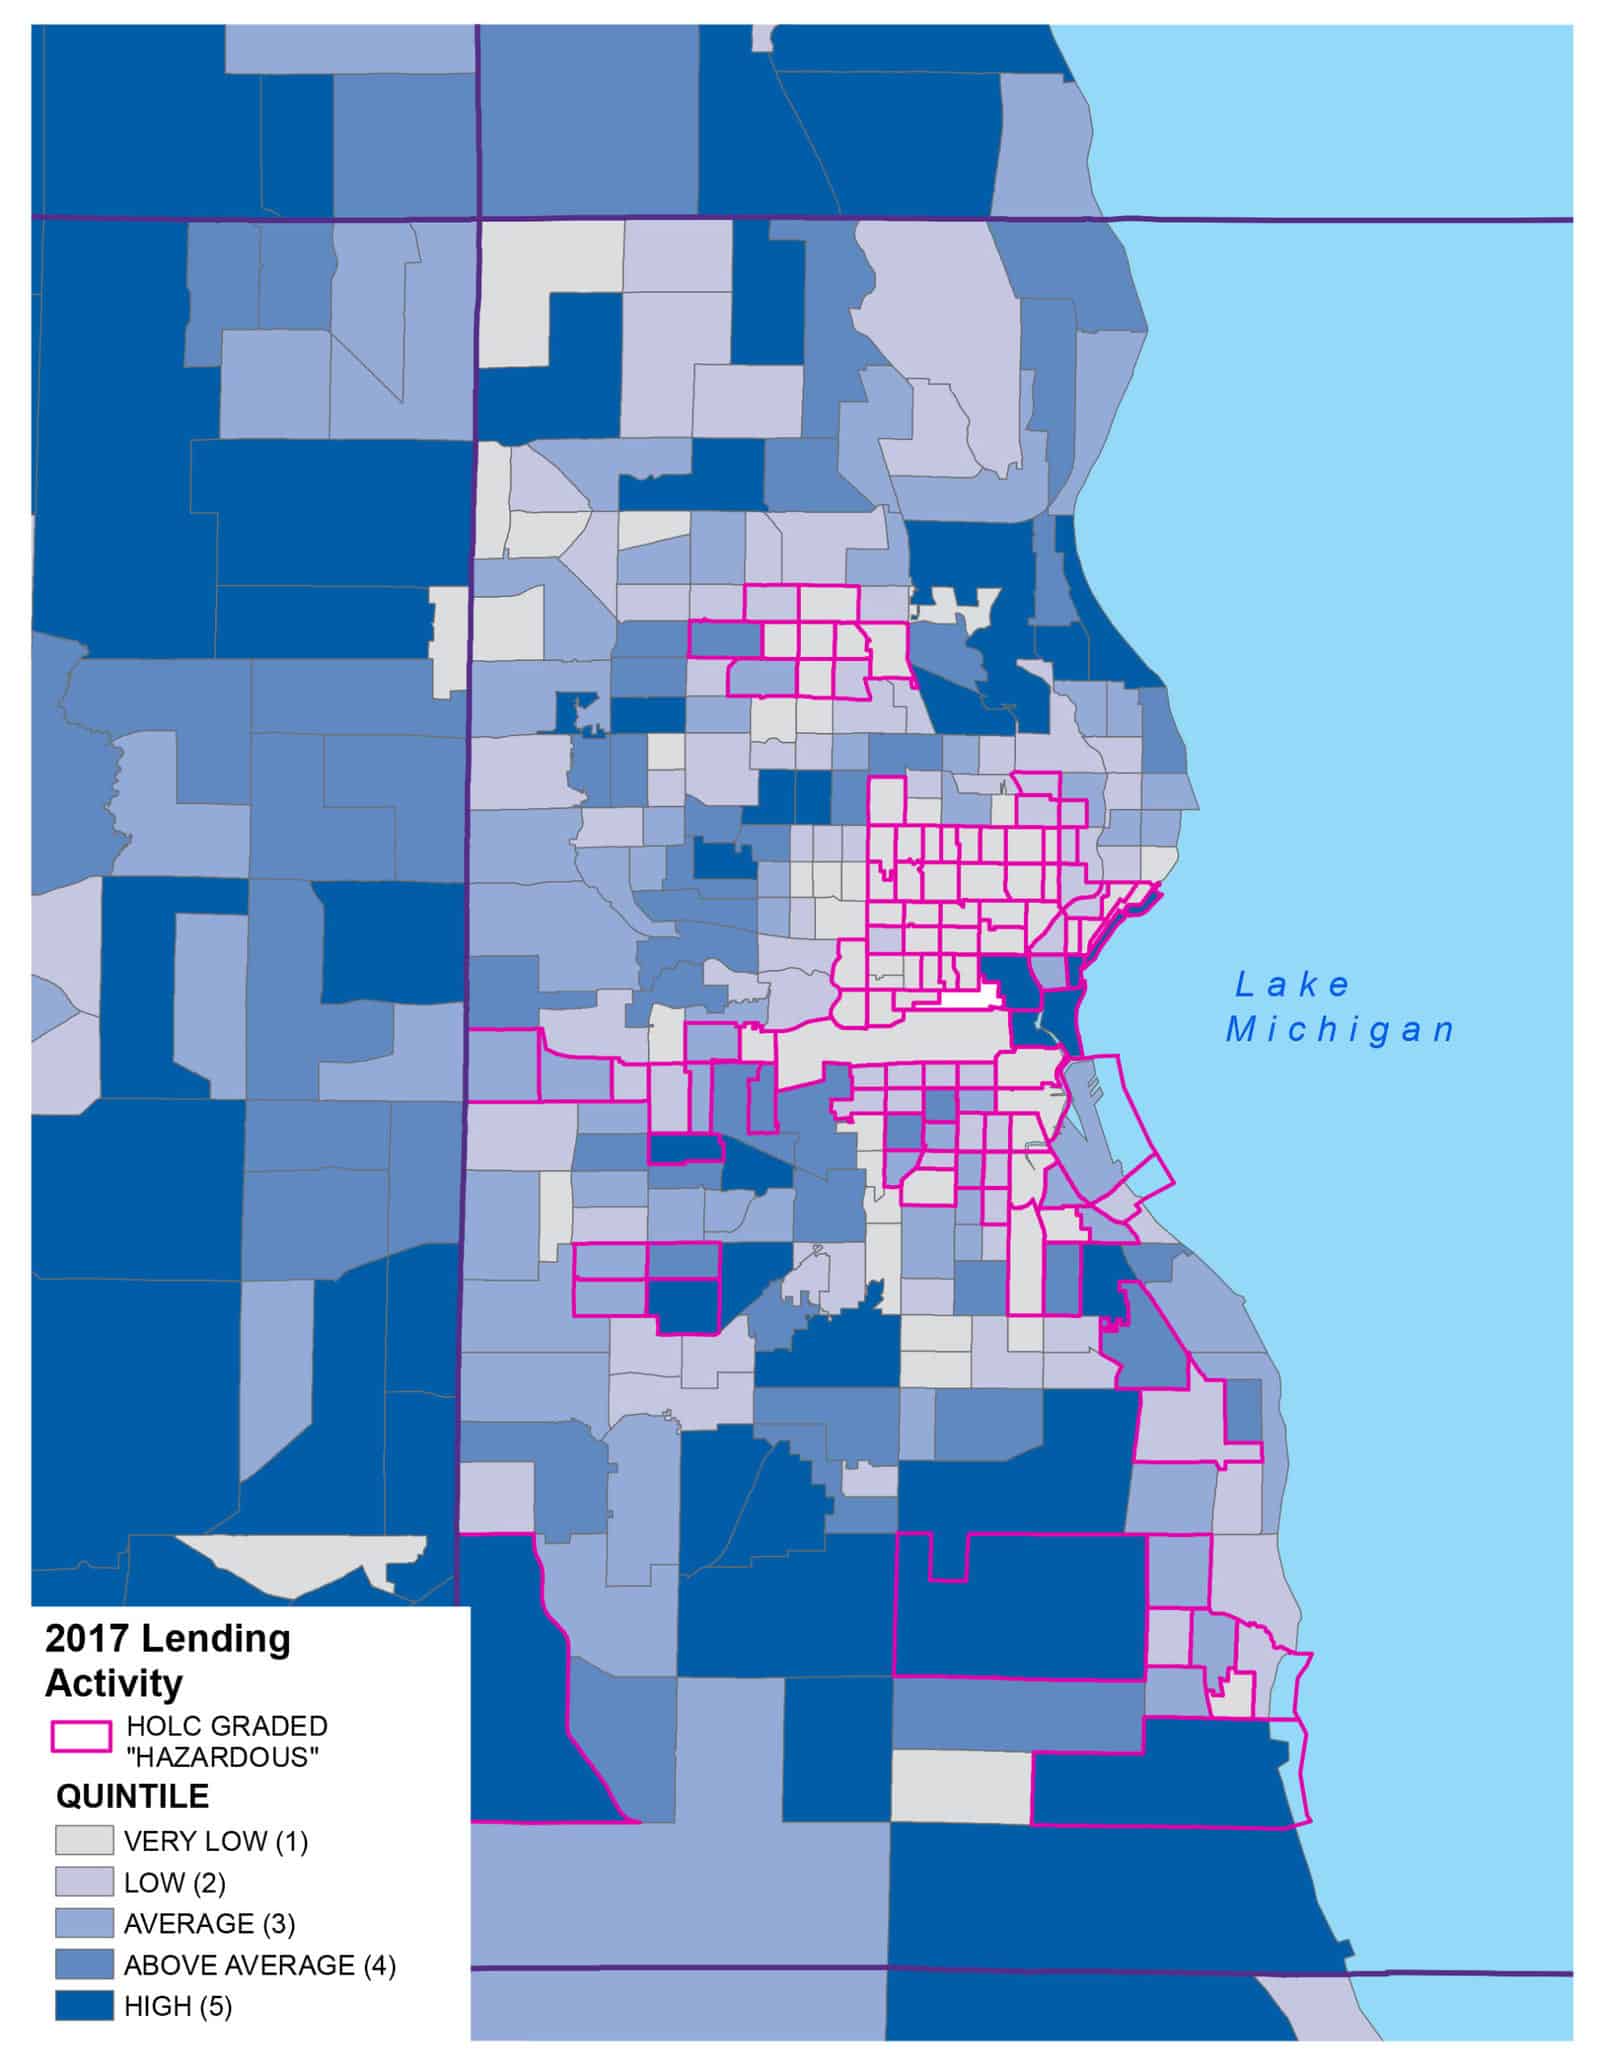
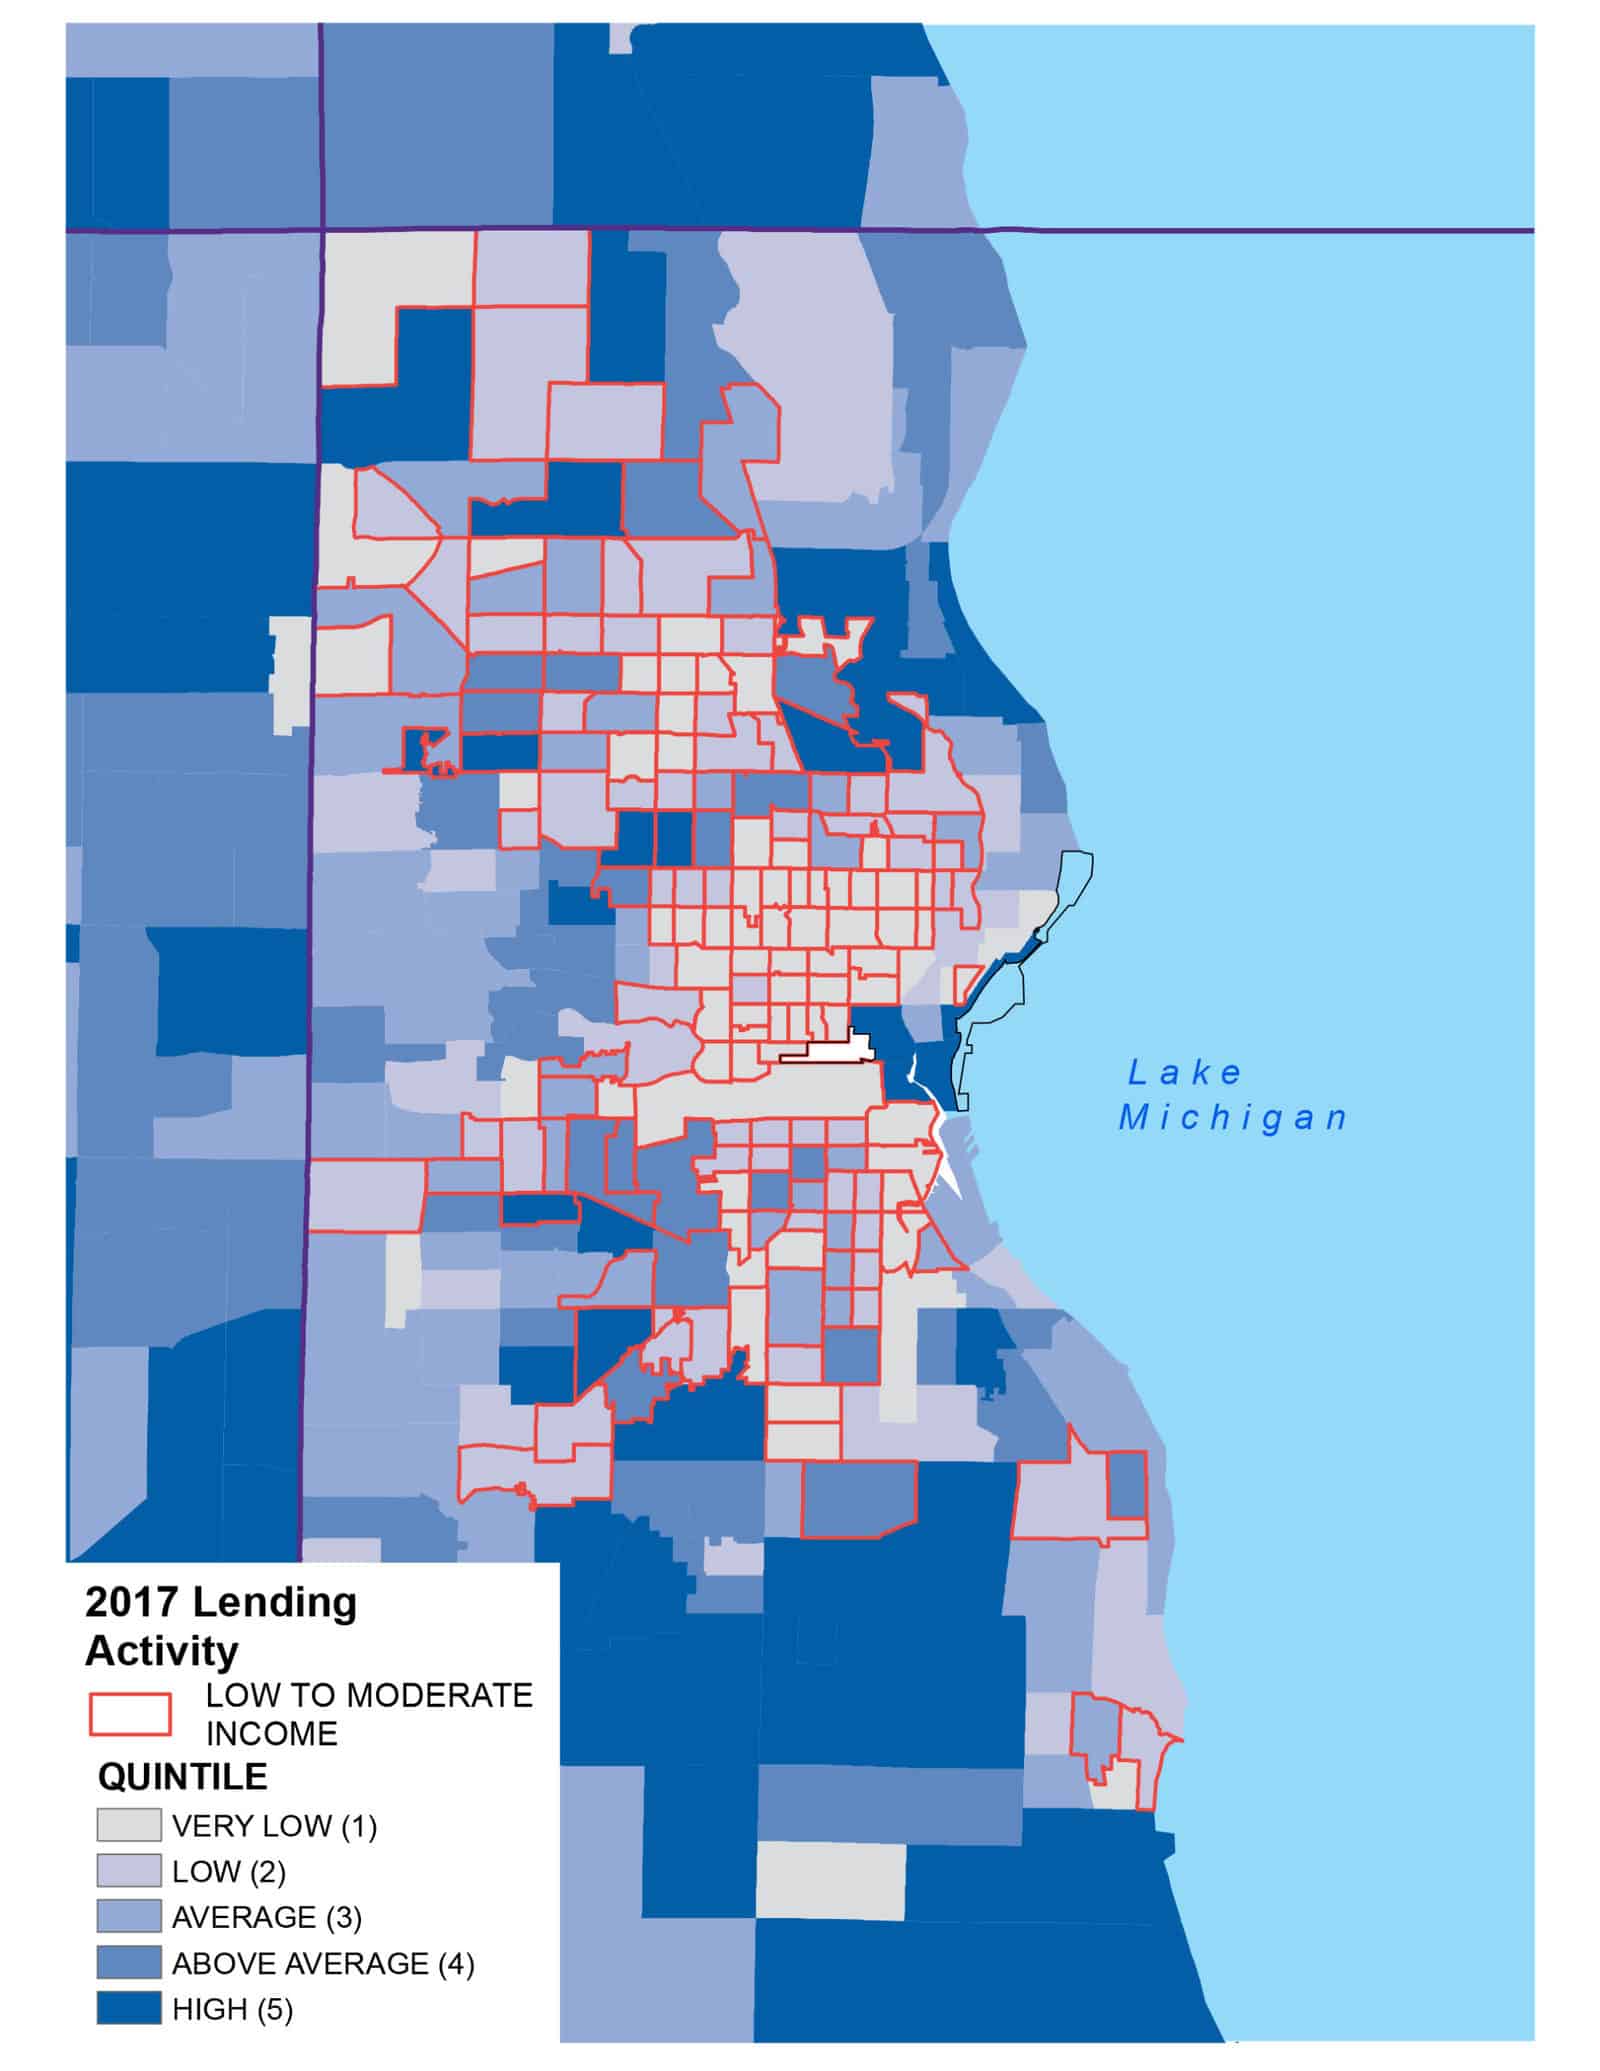
In order to further test the robustness of this classification system, NCRC has highlighted two MSAs with significantly different economic and demographic conditions. The results for Milwaukee and Washington, D.C., confirmed that the classification system based on levels of lending work for different MSAs. For example, while the Washington, D.C., area had overall higher levels of lending than Milwaukee, the quintiles for both areas showed significantly lower levels of lending per housing unit or business in Quintiles 1 and 2 than for Quintiles 4 and 5. The demographic characteristics were also consistent across both MSAs with significantly higher percentages of communities of color in the lower quintiles and higher percentages of LMI tracts in the lower quintiles. The economic characteristics were also consistent across quintiles. While overall poverty levels were higher in Milwaukee and income levels were lower, the quintiles in both MSAs displayed higher percentages of poverty and lower average income in the lower quintiles(as shown below in the tables in the appendix).
The Federal government did not make HOLC maps for the Washington, D.C., area. Hence, the column in the table that showed the number of redlined tracts had a notation of “Not Applicable.” For the Milwaukee area, most of the tracts that were redlined were in Quintiles 1 and 2, just like the national sample discussed above.
The columns in the far right of the table show the numbers of tracts that gentrified during two time periods (the first from 2000-2012 and the second from 2012-2017).[9] NCRC’s previous report, Shifting Neighborhoods: Gentrification and Cultural Displacement in American Cities, used a methodology for classifying tracts that had undergone gentrification. Since gentrification was a phenomena that impacted LMI tracts and since a disproportionate amount of LMI tracts were in Quintiles 1 and 2, a substantial number of tracts that gentrified were in Quintiles 1 and 2.
CRA policymakers may want to classify underserved tracts as those that have not gentrified in order to focus CRA activity on underserved tracts that are more likely to have low market levels of economic activity. Excluding gentrified tracts is unlikely to delete most underserved tracts in a MSA. For example, eliminating recently gentrifying tracts during the 2012 and 2017 time periods would result in a subtraction of two tracts from Quintile 1 in Milwaukee and eight in Washington, D.C.
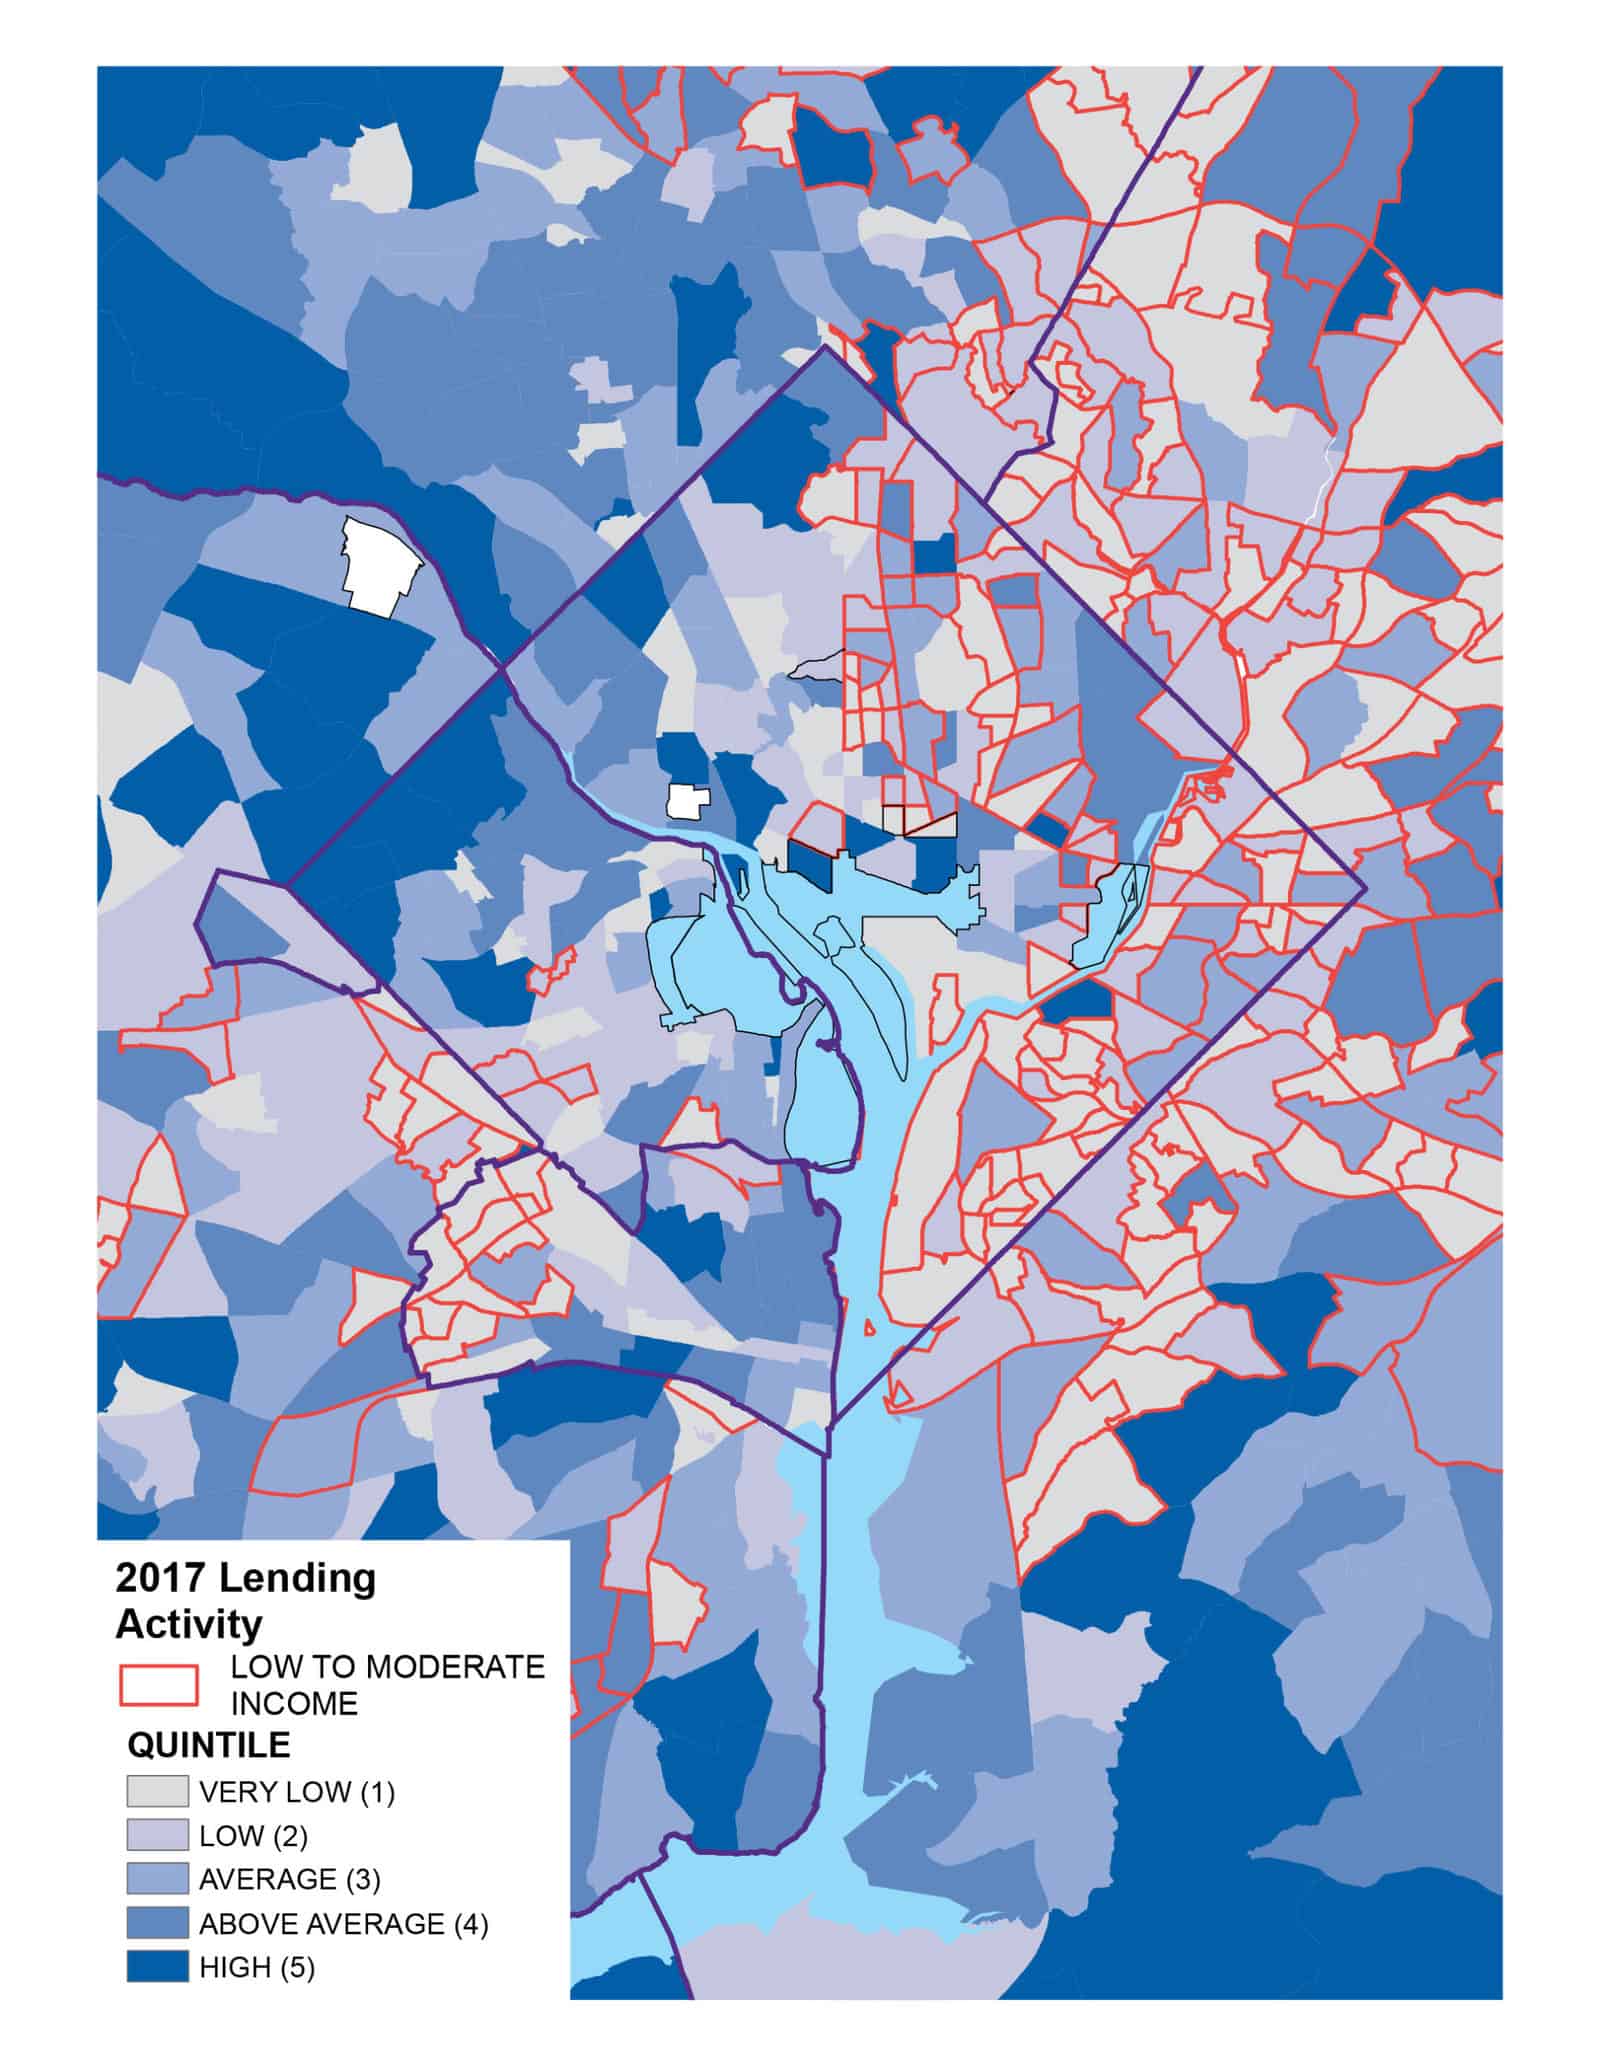
NCRC had also produced maps for the Milwaukee and Washington, D.C., MSAs that illustrate the spatial distribution of quintiles. In the Washington, D.C., area, the maps show Quintiles 1 and 2 clustered in predominantly communities of color in the eastern part of the District of Columbia and in Prince George’s County, which is to the north and east of the District of Columbia. Also, a disproportionate number of tracts in the lower two quintiles were LMI(as shown in the appendix).
Conclusion
This study illustrated that it was feasible and desirable to create a classification of census tracts for CRA called “underserved” that were defined as those with low levels of lending per housing unit and business. When tracts were grouped into quintiles based on lending levels, the tracts in the lowest two quintiles were disproportionately LMI, though not entirely so. They were also predominantly communities of color. A subset of these tracts exhibited indicators of economic distress as shown by high poverty and unemployment levels.
In addition, the tracts were disproportionately redlined in that the HOLC had classified them as definitely declining or hazardous in the 1930s. The approach in this paper, therefore, successfully targeted redlined neighborhoods that were predominantly minority; Quercia and Park documented a lack of bank CRA lending in these neighborhoods.[10]
CRA has focused its attention on LMI communities, as it should. However, communities of color remain underserved because of decades of redlining and discrimination. The proposal of adding underserved tracts as a criterion on the lending, investment and service tests would direct needed lending and investments to these underserved communities. It would also help alleviate pressure on LMI tracts that are gentrifying by giving banks additional geographical areas in which to serve and receive favorable CRA consideration.
The OCC and the Federal Deposit Insurance Corporation (FDIC) recently proposed to add distressed and underserved tracts as geographical areas in which banks could receive CRA credit for lending, investing and the provision of branches. They did not explain their methodology or estimate the impact of their criteria in terms of how many tracts would become CRA eligible or where they were located. The agencies removed the constraint that distressed and underserved middle-income tracts must be in rural areas, and they added a qualification that underserved tracts have no branches.[11] This paper, however, showed that there are a number of LMI and predominantly minority tracts, in addition to middle-income tracts, that remain underserved and should be a subject of focus on CRA exams. The lack of analysis and explanation in the agencies’ proposal renders their choice unsatisfactory.
Some operational considerations should guide the selection of underserved tracts. First, this exercise has considered just CBSAs. A similar approach can identify underserved tracts in rural communities. In fact, the agencies update a list of distressed and underserved middle-income tracts in rural counties to be considered on CRA exams on an annual basis.[12] Our study used additional economic and demographic variables that the agencies should consider in designating census tracts as underserved. Second, the agencies could select either the first and/or second quintiles in our study as underserved tracts. Our preference is using the lowest quintile since including the lowest two quintiles will include 40% of the tracts in an area as underserved, which seems to be on the high side. Further research could inform a decision regarding which quintiles to use. Lastly, to avoid overheating gentrified tracts and possibly causing displacement, NCRC recommends not including tracts as underserved that have recently gentrified.
Policymakers and stakeholders have struggled for several years regarding how to consider communities of color and other underserved communities in addition to LMI communities as part of CRA’s focus. The data driven approach presented in this paper hopefully provides a road map for targeting CRA to truly underserved communities, including but not limited to communities of color. It is a dynamic approach; if the list of underserved tracts is updated periodically (every five years to correspond with new American Housing Survey data), some tracts will be removed from the list because they have been revitalized while other underserved tracts will receive more CRA focus and attention.
Appendix

[1] For a review of the CRA hearings and passage of CRA in 1977, see Josh Silver, The Purpose And Design Of The Community Reinvestment Act (CRA): An Examination Of The 1977 Hearings And Passage Of The CRA, https://ncrc.org/the-purpose-and-design-of-the-community-reinvestment-act-cra-an-examination-of-the-1977-hearings-and-passage-of-the-cra/
[2] For an overview of continued racial disparities in lending, see Aaron Glantz and Emmanuel Martinez, For People of Color, Banks are Shutting the Door on Homeownership, February 15, 2018, https://www.revealnews.org/article/for-people-of-color-banks-are-shutting-the-door-to-homeownership//. For documentation of high cost lending targeting communities of color, see NCRC, Foreclosure in the Nation’s Capital: How Unfair and Reckless Lending Undermines Homeownership, April 2010, https://ncrc.org/foreclosure-in-the-nations-capital-how-unfair-and-reckless-lending-undermines-homeownership/. Also, see NCRC, Income is No Shield Against Racial Disparities in Lending II: A Comparison of High-Cost Lending In America’s Metropolitan and Rural Areas, July 2008, https://ncrc.org/wp-content/uploads/2008/07/income%20is%20no%20shield%20ii.pdf
[3]Comptroller’s Handbook, Community Reinvestment Act Examination Procedures, October 1997, p. 39, https://www.occ.gov/publications-and-resources/publications/comptrollers-handbook/files/cra-exam-procedures/pub-ch-cra-exam-procedures.pdf, Also, see Large Institution CRA Examination Procedures
OCC, FRB, and FDIC, April 2014, p. 7, https://www.federalreserve.gov/supervisionreg/caletters/CA_14-2_attachment_1_Revised_Large_Institution_CRA_Examination_Procedures.pdf
[4] See FDIC Bank of the West CRA exam, August 2017, p. 37, https://www7.fdic.gov/CRAPES/2017/03514_170821.PDF
[5] OCC, ANPR see Question 17, https://www.regulations.gov/document?D=OCC-2018-0008-0001
[6] Jason Richardson, Bruce Mitchell, Juan Franco, NCRC, Gentrification And Cultural Displacement Most Intense In America’s Largest Cities, And Absent From Many Others, March 2019, https://ncrc.org/study-gentrification-and-cultural-displacement-most-intense-in-americas-largest-cities-and-absent-from-many-others/
[7]Carolina Reid, Quantitative Performance Metrics for CRA: How Much “Reinvestment” is Enough? in Penn Institute for Urban Research, September 2019, p. 12, https://penniur.upenn.edu/uploads/media/Quantitative_Performance.pdf
[8]Jason Richardson, Bruce Mitchell, Juan Franco, NCRC, HOLC “redlining” maps: The persistent structure of segregation and economic inequality, March 2018, https://ncrc.org/holc/
[9] Jason Richardson, Bruce Mitchell, Ph.D., Juan Franco, Shifting Neighborhoods: Gentrification and Cultural displacement in American Cities, NCRC, March 2019, https://ncrc.org/gentrification/. This report describes a methodology of how to categorize tracts as gentrified.
[10] Kevin A. Park and Roberto G. Quercia, Who Lends Beyond the Red Line? The Community Reinvestment Act and the Legacy of Redlining, a Penn Institute for Urban Research working paper, September 2019, https://penniur.upenn.edu/uploads/media/Park_Quercia.pdf
[11] Office of the Comptroller of the Currency and Federal Deposit Insurance Corporation, Notice of Proposed Rulemaking, Community Reinvestment Act Regulations, https://www.fdic.gov/news/board/2019/2019-12-12-notice-dis-a-fr.pdf, pp. 126 & 131.
[12] For a description of underserved and distressed tracts, see the FFIEC website, https://www.ffiec.gov/cra/pdf/Regulatory%20Background%20-%20Distressed%20and%20Underserved%20Tracts%20FINAL.pdf
Bruce Mitchell, PhD, Senior Analyst, Research & Evaluation, NCRC
Josh Silver?, Senior Advisor, NCRC
