Displaced by Design:
Fifty years of gentrification and
Black cultural displacement in US cities
May 2025
Photo: Bruce C. Mitchell
Bruce C. Mitchell, PhD, Principal Researcher, NCRC
Jad Edlebi, GIS Data Engineer, NCRC
Helen C.S. Meier, PhD, MPH, Research Assistant Professor, Survey Research Center, Institute for Social Research, University of Michigan
Jason Richardson, Senior Director, Research, NCRC
Joseph Dean, Racial Economic Junior Research Specialist, NCRC
Liang Chen, PhD, Postdoctoral Research Fellow, Survey Research Center, Institute for Social Research, University of Michigan
Key Takeaways
1
Over the past fifty years, 15% of urban neighborhoods show indications of gentrification.
2
While gentrification is uncommon, it is increasing. The number of gentrifying urban neighborhoods increased over the past fifty years, from 246 during the 1970s to 1,807 in the 2010s.
3
In the 2010s, the five most gentrified cities were: Nashville, Tennessee, Washington, DC, the San Francisco Bay area, Denver, and Austin, Texas.
4
Gentrification impacted 523 majority-Black neighborhoods between 1980 and 2020. A third (155) of those neighborhoods underwent full racial turnover, while almost a quarter (121) are now diverse, racially mixed neighborhoods.
5
There are 261,000 fewer Black people living in gentrifying neighborhoods that were majority-Black, indicating considerable displacement since 1980. Estimates of displacement rates could range higher, with a decrease of half a million Black people in all gentrifying neighborhoods.
6
Cities most impacted by neighborhood racial turnover and displacement include: Washington, DC, New York City, Philadelphia, New Orleans, Atlanta and the San Francisco Bay area.
Interactive Map Application
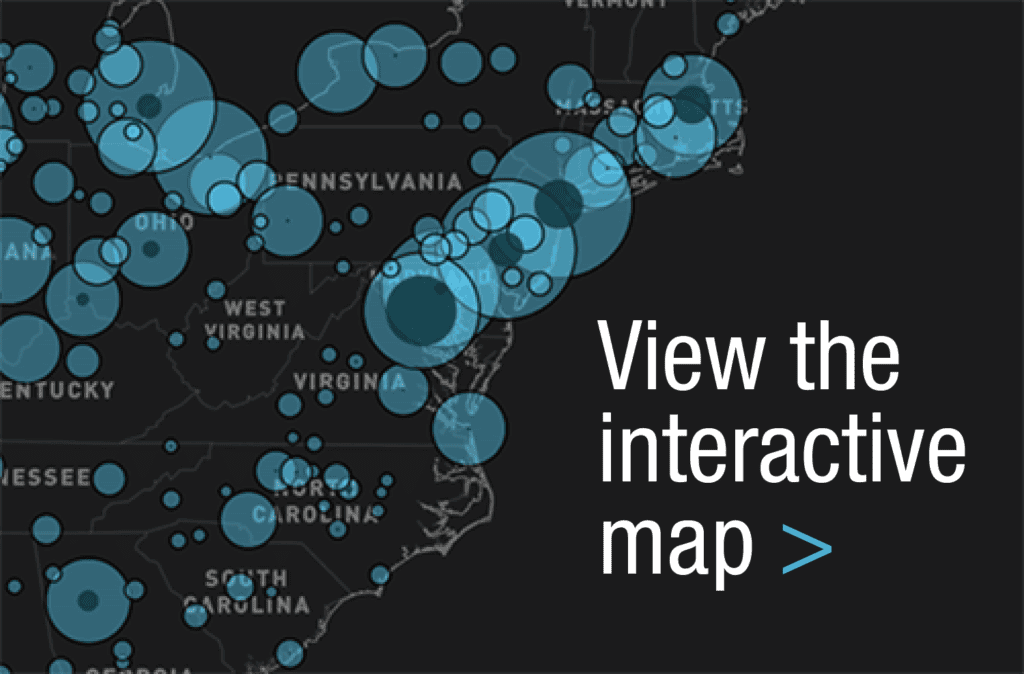
The Displaced by Design interactive map application visualizes 50 years of neighborhood change and gentrification across U.S. cities, from 1970 to 2020. It provides a powerful, data-driven look at how urban development has reshaped communities—often along racial and economic lines.
Through interactive maps, users can explore shifts in population by race and ethnicity, along with changes in median income, home values, and educational attainment at the neighborhood level. By highlighting these long-term trends, the tool helps illustrate the cumulative impacts of policy, investment, and displacement on historically marginalized communities.
Introduction
While walking through the neighborhood surrounding Lafayette Park in St. Louis, one is struck by the beauty of the park, the elegant historic homes surrounding the square and the vibrancy of the neighborhood. However, the neighborhood wasn’t always this way. After being fully developed in the late 19th century, the Great Cyclone of 1896 left a mile-wide swath of destruction across the city, prompting a prolonged period during which the properties surrounding Lafayette Park fell into disrepair. Subsequently, a process of rehabilitation and gentrification began in the 1970s initiated at the grassroots level by homeowners who purchased properties and restored them (Figures 1a and 1b). The park, possibly the oldest public park west of the Mississippi River, has also undergone a major restoration and replanting effort under the diligent care of neighborhood residents. Considering the beauty of the neighborhood, it may be difficult to believe that the revitalization occurring there has had a negative effect on the community. The restoration of the homes, access to local restaurants and small businesses and relative safety of the area make it one of the most desirable places to live in the city. This sort of neighborhood transformation is an example of the type of gentrification defined by the sociologist Ruth Glass back in the 1960s. She observed a neighborhood dynamic of older, architecturally charming housing in lower-class areas being purchased and fixed-up by wealthier Londoners, changing the neighborhood’s overall upkeep and preservation, increasing the property values and improving access to businesses and services. However, Glass was concerned that displacement of the working class would result in London becoming “exclusively reserved for higher class strata”[1].
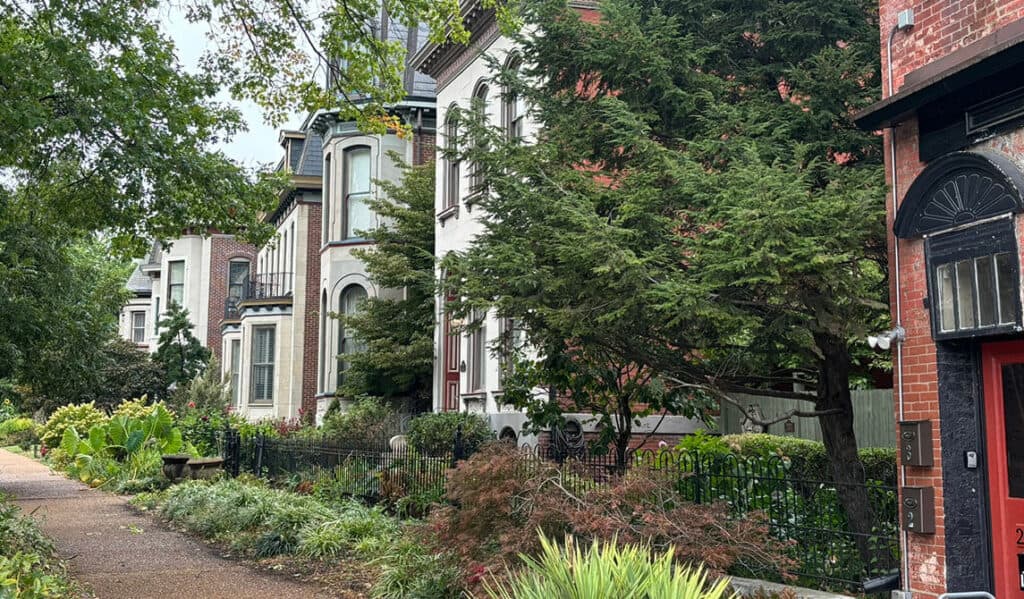
Figure 1a. Homes along Park Avenue across the street from Lafayette Park in 2024. These have retained the original character of the neighborhood, maintaining its historical and cultural integrity (Source: Bruce C. Mitchell).
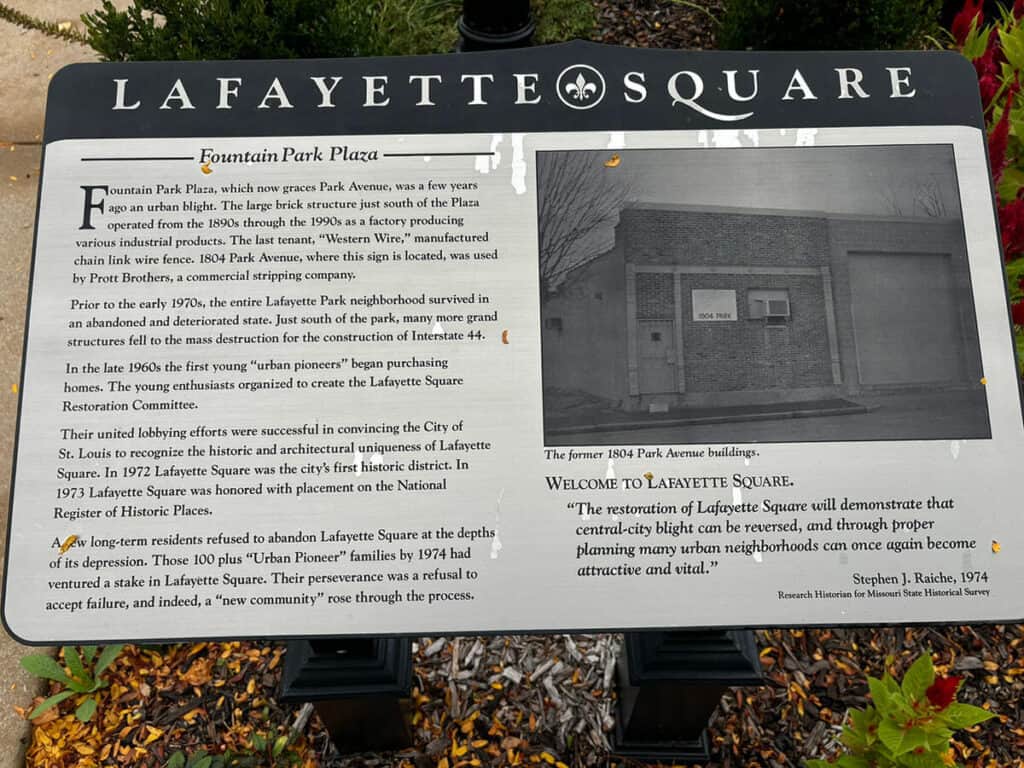
Figure 1b. Plaque commemorating the revitalization efforts in the Lafayette Square neighborhood surrounding the park in St. Louis (Source: Bruce C. Mitchell).
While the type of gentrification that took place in the Lafayette Square neighborhood in St. Louis seems to have revitalized the community, there are other areas in which gentrification is much more contested: places where decreased affordability displaced prior residents, resulting in wholesale cultural displacement. While Glass was focused on how gentrification shapes neighborhood class structure, the dynamic of cultural displacement highlights its broader socio-cultural impacts. Changes in neighborhood demographics and services disrupt existing social networks and the cultural identity of the original residents, leading to a sense of loss and alienation. An example of this might be the U Street/Shaw neighborhood in Washington, DC, a historically significant Black community where gentrification has been accompanied by intense commercialization and has become the source of social tensions (Hyra, 2017) (Figure 2a and 2b). The type of gentrification dynamic occurring in this DC neighborhood has been largely developer-driven, resulting in the commodification of Black culture and history and new apartment buildings increasing the density of the area. There is some superficial commemoration of the neighborhood’s Black history, but the physical and social landscape of the neighborhood have been profoundly altered. The U Street neighborhood has not been restored, but transformed into something different, diminishing the historical and cultural character of the area. Local resistance to gentrification intensified in 2019 after a resident of a newly developed apartment complex filed a noise complaint about Go-Go music played outside a longstanding neighborhood business. The incident gave rise to the #DontMuteDC movement, a cultural protest that transformed into a series of block parties and live performances by local Go-Go bands throughout the spring, celebrating the city’s Black cultural heritage and pushing back against displacement.” Link https://www.kennedy-center.org/artists/d/do-dz/dont-mute-dc/

Figure 2a. The intense gentrification and commercialization of the U Street/Shaw neighborhood in Washington, DC in the 2000s and 2010s have culturally and economically transformed this historic Black community (Source: Bruce C. Mitchell).

Figure 2b. The #DontMuteDC cultural protest movement was centered on a dispute about Go-Go music played at the Metro T-Mobile store near The Shay apartments (Source: Bruce C. Mitchell).
Gentrification is a hotly debated issue with its impact viewed differently depending on one’s perspective. What one person sees as gentrification, another might view as needed revitalization. The need to balance cultural loss and reduced affordability against providing infrastructure improvements is of the utmost importance. This approach often leads to enhanced public services, improved infrastructure, higher-quality schools, increased green space maintenance and a more robust public safety apparatus. As new businesses, restaurants and shops open, the local economy expands, creating job opportunities for the community. Property values rise, benefiting homeowners who can sell their homes for a substantial return on investment. There’s also the potential for increased diversity as wealthier residents move into the area, fostering an environment where people from different racial and ethnic backgrounds can coexist. However, the downsides of gentrification are significant and often hit the most vulnerable people the hardest.
As property values and rents increase, long-time residents—typically lower-income renters and those from communities of color—are pushed out of their neighborhoods, unable to keep up with the rising cost of living. This displacement leads to a loss of the cultural identity and social cohesiveness of communities that have lived in the area for generations. As wealthier, sometimes more homogeneous groups move in, local businesses, cultural landmarks and community gathering spaces that have served the original residents may be replaced with more generic, “high-end” alternatives (e.g. the local lunch counter becomes Panera Bread). The intensified focus on public safety associated with these shifts falls very differently upon White newcomers drawn by the changes and longtime residents of color whose experience of policing is often more negative. The benefits of gentrification, such as improved services and rising property values, are not distributed equally. Wealthier, often White, newcomers tend to reap more of the advantages, while lower-income and minority residents bear the brunt of the costs. The disparity reinforces existing racial and economic inequalities.
Not only are the pros and cons of gentrification controversial, but even the methods used to assess whether a neighborhood has gentrified are disputable. Various metrics – such as income levels, housing prices or demographic shifts – can be used to measure gentrification, with different approaches yielding different conclusions about the extent and impact of these changes (Finio, 2022). This lack of consensus makes it difficult to develop policies that address both the positive and negative effects of gentrification in an equitable way. Gentrification is a complex phenomenon with both positive and negative consequences. The challenge lies in finding a way to harness the benefits of revitalization while minimizing its social and economic costs.
This report addresses key challenges in measuring gentrification by introducing a new validation method to more accurately identify when and where gentrification occurred in US cities between 1980 and 2022. The analysis also includes an estimation of Black cultural displacement, offering insight into the social disruption that gentrification can cause for residents of lower-income and majority-Black neighborhoods. While Glass outlined a basic definition of gentrification sixty years ago, it lacks a universally agreed-upon methodology for determination purposes. This study uses broadly accepted indicators of gentrification, assessing it by examining income levels, subsequent increases in home values and the proportion of college-educated residents. We further developed a method of validating whether neighborhoods have indications of gentrification by analyzing changes in social class measured through growth in professional, technical and managerial employment as well as shifts in the racial and ethnic composition of neighborhoods, particularly between non-Hispanic White and minority populations. For gentrification that has occurred in the past two decades, an additional indicator is used to assess changes in mortgage lending activity. Finally, we assess cultural displacement in neighborhoods that exhibited signs of gentrification and transitioned from majority-Black populations between 1980 and 2020. This will hopefully provide a rough but more thorough measure of the impact of gentrification on central city[2] neighborhoods.
Gentrification Nation
Over the past fifty years, many urban areas have undergone two significant processes of economic and demographic transformation. Many industrial cities in the Rust Belt region have faced economic and demographic setbacks, resulting in urban decline and abandonment. Meanwhile, larger and more economically prosperous cities have seen population growth and increasing gentrification. While the downtown cores of declining cities aren’t necessarily immune to gentrification, they have not experienced it with the same intensity as expanding cities. When reviewing gentrification by decades, we estimate that 246 census tracts had indications of gentrification during the 1970s[3], with this number increasing sevenfold to 1,807 census tracts in the 2010s (Figure 3). The main driver of this increase lies in our inadequate supply of housing, which has created a situation of scarcity and declining affordability. Our national output of housing has been inadequate to meet demand, and with rising construction costs, developers have shifted to the production of high value housing for wealthier buyers.
Figure 3. Estimates of the numbers of tracts with indications of gentrification nationwide from 1970-2020.
Aside from economic issues, other social factors have driven the pressure to gentrify. Social norms regarding the desirability of suburban living have changed, leading to a resurgence of downtown neighborhoods. Downtowns, with their amenities, jobs and cultural access, have become the trendy place to live for young professionals (Florida, 2003). City planners and developers have understood these shifting dynamics and, following Richard Florida’s hypothesis, integrated them into their redevelopment and revitalization efforts. Cities like Austin, Texas with its vibrant local music scene (Peck, 2005), Portland, Oregon with its emphasis on sustainability and its local creative industry (Hutton, 2009), and Pittsburgh, a flourishing tech hub (Markusen and Gadwa, 2010), have all been in the top rankings of gentrifying cities nationally. The expanding economies of cities like these encouraged an intensification of gentrification, which explains the increasing number of impacted neighborhoods. In total, we estimate that 4,070 census tracts show indications of gentrification over the past fifty years. This amounts to 15% of downtown census tracts nationally. This underscores the findings in our prior reports that gentrification is relatively uncommon. However, where it does occur it can be quite intense, having a lasting impact on historically marginalized communities.
Metro Rankings
NCRC defines the intensity of gentrification in metro areas as the percentage of neighborhoods eligible to gentrify at the beginning of a decade which did gentrify at the end of that decade. This is the preferred baseline for the rankings outlined in this report. However, a few changes were made for some of the other methods in this report. First, we used longitudinal census data to expand the time frame, looking at changes by decade since the 1970s. Then, we introduced validation methods to more accurately adjust our modelsLastly, because of our use of longitudinal data from the longitudinal tract database, the time frames used to evaluate gentrification differ somewhat from our Shifting Neighborhoods report (2000-2013), the 2000-2012 time period, and the 2012-2022 time period. Consequently, Atlanta, Georgia from 2000-2012 and Nashville, Tennessee from 2012-2022 are ranked as having the greatest intensity of gentrification. Washington, DC took the second position over the two consecutive periods (Table 1).
Table 1. Rankings of cities’ gentrification intensity from the 1970s-2010s.
Several cities stand out in our rankings, with Denver, CO consistently appearing in the top rankings decade after decade. Other notable cities that appeared in the rankings: New York City, Chicago, Seattle, and more recently Portland, Oregon, and Washington, DC. With a few exceptions, cities in the top rankings share an economic dynamic of growth and population expansion. Considering the prevalence of economically dynamic cities, the appearance of Cincinnati, St. Louis, New Orleans and Buffalo, New York, more recently are initially surprising until the recent history of those cities is examined. St. Louis saw the revitalization of several neighborhoods in its downtown and midtown areas, near the Botanical Heights neighborhood, and on Cherokee Street. St. Louis is a classic case of neighborhood rebound, in which declining areas of a city stabilize and regain their viability rather than continuing to decline in population (Swanstrom, et. al., 2015). While the cities of Cincinnati, Buffalo, and St. Louis have experienced periods of revitalization, New Orleans remains substantially reconfigured post-Katrina, with the redevelopment of entire neighborhoods and a substantial decrease in historic residents after 2010. While these rankings give us a good idea of which cities have been most impacted by gentrification, the question of how much gentrification has had an effect on the displacement of Black communities is more difficult to answer.
Urban areas in the United States have undergone significant demographic changes over the past fifty years. In 1970, approximately 74 million people lived in the central cities of urban areas, a figure that grew to 115 million (a 56% increase) by 2020. This population growth has been accompanied by increasing racial and ethnic diversity. In particular, suburban and urban areas have seen larger increases in Hispanic and Asian populations compared to rural areas (Pew Research, 2018). Gentrification has been a key factor driving many of these neighborhood changes. However, not all of the neighborhoods experiencing population increases exhibit indications of gentrification. Figures 4a and 4b depict population trends by race and ethnicity in central city neighborhoods. The data reveals that population growth has been substantially greater in non-gentrifying neighborhoods. Between 1970 and 2020, non-gentrifying neighborhoods experienced an increase of over 40 million residents, compared to only 2.9 million in gentrifying neighborhoods.
While there has been greater population growth in non-gentrifying neighborhoods by and large, the demographic shifts are quite distinct from neighborhoods with indications of gentrification. A broad examination of these trends from 1980 to 2020 highlights the extent of the demographic shift In gentrifying neighborhoods, the populations of non-Hispanic White, Asian and Hispanic residents grew, while the Black populations declined. Conversely, non-gentrifying neighborhoods experienced a decline in non-Hispanic White residents, but saw increases in Black, Asian and Hispanic populations (Table 5). Notably, the population growth in non-gentrifying neighborhoods was primarily driven by minority groups, whereas gentrifying neighborhoods saw increases predominantly among Asian, non-Hispanic White and Hispanic residents.
Figures 4a and 4b. Changes in population by decade in non-gentrifying and gentrifying neighborhoods nationally.
Table 2. Total population changes by race/ethnicity nationally in gentrifying and non-gentrifying neighborhoods. (Source: Calculation of central city census tracts via Brown University’s Longitudinal Tract Database (LTDB) population data)
The impact of gentrification on the demographic composition of majority-Black neighborhoods has been substantial. Figure 5 shows neighborhoods that became gentrified by 2010 and the changes in the neighborhoods’ majority racial/ethnic groups between 1980 and 2020. To account for the gradual nature of demographic turnover, neighborhoods that began gentrifying during the most recent decade were excluded from the analysis. Among majority-Black neighborhoods that underwent gentrification in 1980, nearly half (47%) were no longer majority-Black by 2020. Of these, 23% transitioned to no longer have any one clear racial/ethnic majority – becoming what demographers refer to as “racially mixed neighborhoods” – while 29% became majority non-Hispanic White or majority-Hispanic neighborhoods. For majority-Hispanic neighborhoods, 43% transitioned to being either majority non-Hispanic White or racially mixed neighborhoods. In contrast, gentrifying non-Hispanic White neighborhoods tended to remain White, though 17% transitioned to becoming racially mixed neighborhoods. Only 3% of non-Hispanic White neighborhoods transitioned to majority-Black, and 5% transitioned to majority-Hispanic.
Figure 5. Changes in the racial/ethnic majority of gentrifying neighborhoods.
As central cities in urban regions have experienced substantial population growth, how has demographic change affected gentrifying and non-gentrifying neighborhoods? Figures 6a and 6b illustrate the percentage changes in White, Black, Asian and Hispanic populations between 1980 and 2020. Both figures highlight increasing neighborhood diversity during this period, which was primarily driven by the growth of the Asian and Hispanic populations.
Table 3. Metro areas with the largest changes in gentrifying* majority-Black neighborhoods between 1980 and 2020.
*Neighborhoods gentrified by 2010
Displacement can occur when a neighborhood becomes unaffordable to pre-existing residents, causing them to move out in search of less expensive housing. Because there are so many different motivations for moving that tend to overlap with one another, it’s notoriously difficult to measure rates of mobility (Easton, et. al., 2019). However, displacement is distinct from residential mobility. Residential mobility is voluntary relocation, while the dynamics of displacement are driven by changes in housing availability and affordability for a variety of reasons (rising rents, conversions of rental units to condominiums, landlords opting out of federal programs which subsidize rents, and rising property taxes) (Reardon, et. al., 2014). For our purposes, we assessed whether majority-Black neighborhoods had indications of gentrification and whether they shifted to White and Hispanic majorities over the past forty years. This combination of gentrification and neighborhood demographic turnover indicators is simplified, but is still an indicator of whether racial turnover and cultural displacement have occurred. The neighborhoods with indications of gentrification, which then experience racial turnover, were then evaluated for their loss of Black residents.
Figures 6a and 6b. Comparison of the demographic change in non-gentrifying and gentrifying neighborhoods for the 1980-2020 time period.
General population trends in the decades preceding and following gentrification were analyzed as an initial step. The analysis reveals that population decline preceded gentrification in nearly two-thirds (64.8%) of the 4,070 tracts that were exhibiting signs of gentrification over the past fifty years. Figure 7 illustrates this trend, showing a period of decline followed by gentrification and subsequent population growth during the following decade. These findings align with the theory that neighborhood decline and abandonment are precursors to gentrification (Smith, 1979). In essence, neighborhoods that become undervalued while possessing desirable attributes, such as convenient location, historic architecture, proximity to transportation and access to amenities, are particularly susceptible to gentrification.
Figure 7. Overall population trendline of neighborhoods with indications of gentrification prior to 2010(N=2,303).
Next, we assessed population decline in neighborhoods which gentrified and transitioned from Black or Hispanic majorities to a majority-White population between 1980 and 2020 (Figures 8a and 8b). The pattern of general population decline was evident, specifically for majority-Black neighborhoods in the two decades preceding gentrification. Racial transition occurred during the decade of gentrification, with a continued increase of White populations and a decreasing of Black and Hispanic populations over the following two decades. In the case of majority-Hispanic transitions to majority-White, the smaller average Black population did not notably decrease in subsequent decades.
Figures 8a and 8b. General trend lines of demographic transition from majority-Black and majority-Hispanic neighborhoods to majority-White neighborhoods.
The trajectory of the majority-Black to majority-Hispanic transition in gentrifying neighborhoods was notably different (Figure 9). While the Black population has declined in prior decades, the increasing numbers of people of Hispanic descent seemed to abate neighborhood population decline. The transition from majority-Black to majority-Hispanic neighborhoods occurred during the decade prior to gentrification, with the number of Hispanic people continuing to increase over subsequent decades. The Black to Hispanic demographic transition mainly occurred in Los Angeles, New York City, Dallas, Houston and Phoenix.
Figure 9. Black to Hispanic demographic transition in gentrifying neighborhoods.
Unless there is sudden and substantial reconfiguration and redevelopment of the housing and built environment of a neighborhood, neighborhood change unfolds over longer time periods. The above trend lines provide a way for us to visualize these general patterns. However, Figure 10 specifically examines majority-Black neighborhoods that gentrified and underwent demographic transition in 1980, along with counts of the population shifts. The scope of the demographic shifts were impacted by the number of affected neighborhoods for each decade and as well as the amount of time in which Black displacement occurred. The figure shows that the 1970s and 1980s had many fewer neighborhoods impacted by gentrification than later decades. However, sufficient time has elapsed for neighborhood demographic changes to occur. The 2000s and 2010s showed a much larger impact on Black neighborhoods, with dramatic demographic shifts occurring specifically in the 2000s. The full extent of displacement that occurred as a result of gentrification in the 2010s isn’t completely clear.
Figure 10. Demographic changes by decade in gentrifying majority-Black neighborhoods.
Examining the extent of demographic change and displacement in key metro areas, we see that the number of majority-Black neighborhoods that gentrified along with the change in non-Hispanic White, Black, Asian and Hispanic populations as a whole since the 1970s (Table 3). Washington, DC experienced the greatest impact with a decline of over 61k Black residents and an increase of over 54k non-Hispanic White residents, suggesting heavy gentrification and displacement. The major cities of New York City, Los Angeles and Atlanta all reflect similar demographic turnover in more than 10 neighborhoods, with between 11k and 27k population decreases, respectively. Overall, the table underscores how gentrification is associated with substantial Black population loss, particularly in Washington, DC, New York City and Atlanta, with corresponding increases in non-Hispanic White populations and smaller increases in Asian and Hispanic population growth.
Table 4. Metro-level demographic changes in majority-Black neighborhoods.
Two Cases of Gentrification: St. Louis and Washington, DC
The St. Louis metro area has seen a dramatic decrease in population from its peak in 1950 when 857,000 people lived in the area. Post-industrial decline ravaged the city, leaving only 282,000 residents by 2020, a decline in population exceeded only by the cities of Youngstown, Ohio and Detroit. The downtown core saw widespread abandonment of residential structures. The trajectory of population loss and demographic change for non-gentrifying neighborhoods is shown in Figure 11a. Both White and Black residential totals declined as the overall population shrank, but there has been a modest increase in Asian and Hispanic residents. In contrast, gentrifying neighborhoods of St. Louis show a pattern of White population loss leveling out over time, but continuing declines in Black residents (Figure 11b). However, none of the majority-Black neighborhoods of St. Louis with indications of gentrification occurring over the past fifty years became majority White by 2020. Many of these neighborhoods of St. Louis may be characterized as “rebound neighborhoods”, a neighborhood with increasing numbers of higher income professional residents and lower levels of cultural displacement for the historic population (Swanstrom, et. al., 2015).
Figures 11a and 11b. General trend lines of demographic transition from majority-Black and majority-Hispanic neighborhoods to majority-White neighborhoods.
The Lafayette Square community area of St. Louis, MO
The neighborhood surrounding Lafayette Park (Figure 12) experienced a rapid decline in population from 1970 to 1980, with a leveling of White population loss taking place followed by an increase after 2000 as the impact of revitalization and gentrification became more pronounced (Figure 13). While the neighborhood has been subject to the same sort of decline seen across the St. Louis metro area, the decline in the Black population within the neighborhood is less pronounced than the average decline in other gentrifying areas of St. Louis. The Black population of the area was around 1,000 in 1970, but fell to 800 by 2020. This 20% drop in the Black population is less than in other gentrifying neighborhoods of the city, which had an average drop of 50%. The White population in the area of Lafayette Square was 3,440 by 1970, declined to 1,055 by 2000, then increased over the following two decades to 1,460 by 2020. The area is less densely populated than it was in 1970, with the vacancy rate declining from 21.8% in 2000 to 11.7% in 2020 as the population count rebounded. Overall, gentrifying neighborhoods in St. Louis demonstrate population stability, or modest growth, while non-gentrifying neighborhoods face continuous population loss. The growth of White populations is a defining feature of gentrifying neighborhoods in St. Louis, while non-gentrifying neighborhoods show continued out-migration of White residents. While there is a decline in Black residents in gentrifying neighborhoods, none of the majority Black neighborhoods have seen turnover and wholesale cultural displacement.

Figure 12. Gentrification of neighborhoods surrounding Lafayette Square in St. Louis, MO.
Figure 13. Population change for the area surrounding Lafayette Square in St. Louis, MO.
Population and demographic change in Washington, DC
The trajectory of population and demographic change in Washington, DC are in contrast with those of St. Louis (Figures 14a and 14b). However, much like St. Louis, the population living within the district’s boundaries peaked in 1950 at about 802,000. After several decades of population decline, this trend halted around 2010, with the number of DC residents rebounding to almost 690,000 in 2020. For the larger Washington, DC metropolitan area, however, the trend has been one of continuous increase, rising from 2.5 million in 1970 to 5.3 million by 2020. The economy of the DC metro area has proven itself resilient due to the concentration of government employment, a diversified professional services sector and its many healthcare and educational anchor institutions. These trends highlight the distinct regional dynamics at play, with the city of Washington, DC experiencing a recovery within its boundaries, while the broader metropolitan area has grown steadily.
Figures 14a and 14b. Washington, DC’s non-gentrifying and gentrifying neighborhoods.
The U Street/Shaw neighborhood in Washington, DC
The U Street/Shaw neighborhood typifies the dynamic of gentrification where long term decline followed by intensive gentrification takes place, in addition to White population growth and racial turnover. This historically Black neighborhood has deep cultural roots as an entertainment district centered around the Howard Theater and Howard University. The process of gentrification started earlier here than in other parts of DC in the 1990s as Green Line metro stations opened, and a sports arena and convention center debuted in the nearby Chinatown and Mt. Vernon neighborhoods (Figure 15). These public infrastructure projects, along with the sale of property originally slated for development as condos and apartments by the Washington Area Metropolitan Transit Authority, further transformed the area. The trajectory of population decline and rapid population increase has been extensive in this neighborhood, where the population had declined to about 2,500 by the year 2000 and increased to over 6,000 by 2020. However, the Black population continued to decrease from around 1500 to not even 1,000 by 2020. Meanwhile, the White population was triple that of the Black population by 2020, a substantial racial and cultural turnover of the area (Figure 16).

Figure 15. Neighborhood around the U Street and Shawarea.
Figure 16. Population and demographic change in the neighborhood around the U Street metro station area since 1970.
Overall patterns of population and demographic change in the Washington, DC area reflect the deep impact of gentrification as a driver of change. Gentrifying neighborhoods have experienced these demographic shifts due to higher-income households moving in, altering the racial composition and increasing the overall population density. In contrast, there has been considerable stability in non-gentrifying neighborhoods of the urban core with limited demographic change due to the increase in Asian and Hispanic residents. The year 2000 was an inflection point after which gentrification accelerated, generating some of the most intense changes of any metropolitan area in the US over the past two decades. While the district has become more racially and ethnically diverse, it has also become the site of widespread cultural displacement (Hyra, 2017).
Conclusion
Nationwide patterns of gentrification appear to be accelerating, though it remains less common than population decline and abandonment in American urban neighborhoods. 15% of central city neighborhoods had indications of gentrification, compared to the 26% which had substantial population decline over the past fifty years. Still, the concentration of gentrification in economically vibrant cities like Washington, DC, New York City, Chicago, Los Angeles, Seattle, the San Francisco Bay area, Portland, Oregon and Austin, Texas profoundly impacted communities and precipitated cultural displacement in Black neighborhoods. The analysis of the Lafayette Square area in St. Louis and the U Street/Shaw neighborhood in Washington, DC exemplifies two different ways in which gentrification can occur and its continued impact on neighborhoods: neighborhood rebound and revitalization versus a profound tearing down of neighborhood connections and rearrangement of cultural meaning. Neighborhoods undergoing rebound and revitalization have relatively modest displacement of Black residents.
Displacement is the outcome of the loss of housing affordability, with some city planners and developers balancing the economics of profitable construction with the viability of constructing affordable housing. However, maximizing profitability inevitably wins in this equation and the economics fail to fulfill the needs of low and moderate-income households. High housing prices skyrocketed even further (along with mortgage interest rates) during the COVID-19 pandemic as supply dropped and construction costs climbed. This led to the considerable social costs of homelessness, reduced disposable income for households and cultural displacement. As we have seen, gentrification can occur under different conditions, as an organic outgrowth of community engagement to improve the living conditions in an area, or as a larger scale redevelopment effort. This “displacement by design” causes a fundamental erosion of the history and social connections of neighborhoods. Addressing the challenges presented by gentrification and displacement requires intentional action. City planners, developers and policymakers must actively balance economic interests with the needs of low and moderate-income households. Ensuring genuine community engagement in the planning and assessment processes of revitalization efforts is essential to mitigate the worst impacts of gentrification. Without these measures, gentrification risks deepening inequality, displacing vulnerable communities and erasing the cultural and historical fabric of neighborhoods.
References
Cohen, M., & Pettit, K. L. (2019). Guide to measuring neighborhood change to understand and prevent displacement. Washington, DC: National Neighborhood Indicators Partnership (NNIP). https://www.urban.org/sites/default/files/publication/100135/guide_to_measuring_
neighborhood_change_to_understand_and_prevent_displacement.pdf
Easton, S., Lees, L., Hubbard, P., & Tate, N. (2020). Measuring and mapping displacement: The problem of quantification in the battle against gentrification. Urban studies, 57(2), 286-306.
Finio, N. (2022). Measurement and definition of gentrification in urban studies and planning. Journal of Planning Literature, 37(2), 249-264.
Florida, R. (2003). Cities and the creative class. City & Community, 2(1), 3-19.
Freeman, L. (2005). Displacement or succession? Residential mobility in gentrifying neighborhoods. Urban affairs review, 40(4), 463-491.
Glass, R. (1963) London: Aspects of Social Change. London: MacGibbon & Kee
Hutton, T. A. (2009). “The inner city as a site of cultural production in the new economy: The case of Vancouver and Portland.” Urban Studies, 46(5–6), 1249–1271.
Hyra, D. S. (2017). Race, class, and politics in the cappuccino city. University of Chicago Press.
Maciag, M. (2015). Gentrification report methodology, Governing.com. https://www.governing.com/archive/gentrification-report-methodology.html
Markusen, A., & Gadwa, A. (2010). “Creative placemaking.” National Endowment for the Arts.
Nahm, F. S. (2022). Receiver operating characteristic curve: overview and practical use for clinicians. Korean Journal of Anesthesiology, 75(1), 25-36.
Peck, J. (2005). “Struggling with the creative class.” International Journal of Urban and Regional Research, 29(4), 740–770.
Reardon, T., Martin, C., Partridge, J. (2014). The dimensions of displacement: Baseline data for managing neighborhood change in Somerville’s Green Line corridor, MAPC, Boston. https://www.mapc.org/wp-content/uploads/2017/09/Dimensions_of_Displacement_Final_Draft_2_10_14-1.pdf
Smith, N. (1979). Toward a theory of gentrification: A back to the city movement by capital, not people. Journal of the American Planning Association, 45(4), 538-548.
Swanstrom, T., Webber, H., & Metzger, M. (April 2015). Rebound neighborhoods in older industrial cities: The case of St. Louis. Federal Reserve System Community Development Conference (pp. 2-3). https://www.stlouisfed.org/-/media/project/frbstl/stlouisfed/Files/PDFs/Community
%20Development/Econ%20Mobility/Sessions/SwanstromPaper508.pdf
[1] A discussion of Glass’ views on gentrification is provided in Hamnett and William’s paper “Social Change in London: A Study of Gentrification”,Urban Affairs Quarterly, 1980.
[2] Central city neighborhoods are identified by the CCFlag indicator of census tracts in the Longitudinal Tract Database (LTDB).
[3] While the number of census tracts designated by the US Census Bureau has increased from 65,232 in 1980 to 85,158 in 2020, we have compensated for this by focusing on central city census tracts (27,121 total tracts) and by using the Longitudinal Tract Database to normalize the tracts.
TABLE OF CONTENTS
Subscribe
Get NCRC news and
alerts by email.
