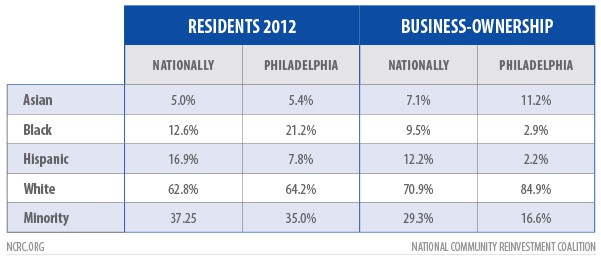
 At the national level, disparities in the proportion of minority-owned and white-owned businesses have been narrowing over time. A 2012 survey of business owners indicated that while nearly 71% of businesses were white-owned, black and Hispanic entrepreneurship increased from 7.1% and 8.3% in 2007, to 9.5% and 12.2%, respectively. Unfortunately, the number of black and Hispanic-owned businesses in the Philadelphia metro area is less reflective of the diversity of its population. While the population of the area is 21.2% black, only 2.9% of businesses are black-owned. A smaller gap in population and business ownership exists for Hispanics, who make up 7.8% of the population, and only 2.2% of business owners.
 Asian-owned businesses constitute a much higher percentage in the area, with 11.2%, and only 5.4% of the population. Unfortunately, the disparity does not end there. NCRC conducted an analysis of business lending by banks in the Philadelphia metro area. All reported business lending in the Philadelphia metro area from 2012-2016 was analyzed, and we found that a much higher proportion of the number of loans went to neighborhoods with white and Asian- majority populations.
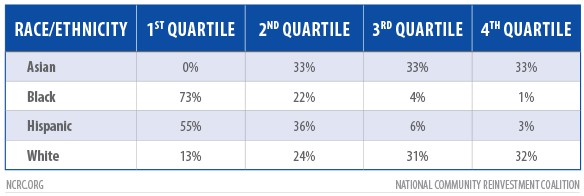
 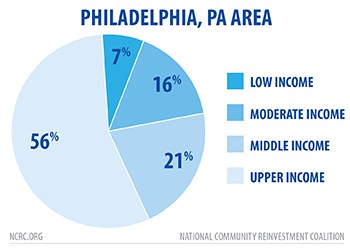 White and Asian-majority neighborhoods were in the top quartiles of the number of business loans received 63% and 66% of the time. Black neighborhoods fared much worse in access to business lending, with 73% of neighborhoods being in the bottom quartile of loans received, while Hispanic neighborhoods were in the bottom quartile 55% of the time. This indicates indicated large disparities in the availability of capital for black and Hispanic entrepreneurs.
In addition to racial disparities in lending, NCRC examined the number of business loans made in low-to-moderate and middle-to-upper income neighborhoods, finding that 78% of business lending flowed to middle-to-upper income neighborhoods. Only 7% of business loans went to low income areas of the metro area.
