
Executive Summary
The proposed changes to the Community Reinvestment Act (CRA) released by the Office of the Comptroller of the Currency (OCC) and Federal Deposit Insurance Corporation (FDIC) would radically reconfigure the testing criteria for banks. A new testing regime would assess low- and moderate-income (LMI) home mortgage and small business lending with a demographic comparison of the LMI population and small business and mortgage lending and a peer comparison with other banks operating in the same market.
But what is the likely outcome of the changes? A lack of public data makes it difficult for the public to know with certainty.
To make matters worse, the OCC and FDIC failed to release the data or results they used to model the proposed changes. But understanding the consequences of the proposed rule changes is central to any informed discussion or public comment about them. So the National Community Reinvestment Coalition (NCRC) developed a model for the proposed retail lending distribution test. The study revealed a system designed to be gamed, especially by big banks that could choose to concentrate their lending in some markets while they ignore others.
NCRC found that while the retail lending distribution test appears to be rigorous, it is deceptive. Banks would only have to pass either a demographic or a peer evaluation to receive an overall passing mark. In NCRC’s model, the demographic evaluation showed very high rates of bank failure, but was wholly invalidated by its companion peer test.
NCRC also developed an alternative, five-tiered grading system to provide more information than a pass/fail system would, and to create stronger incentive for under-performing banks to improve.
The OCC and FDIC’s proposal would encourage the neglect of entire markets by the largest banks, who could then focus their CRA compliance activities on cities where smaller gaps in housing prices and incomes make LMI lending easier. Our analysis exposed the vagueness of the proposed tests and described a scenario under which the largest banks could exploit their large market footprints to achieve a substantial competitive advantage over smaller regional banks. A short public comment period and lack of data included in the proposal are also indicative of the agencies failure to engage the public in a thoughtful discussion of benefits and costs.
Introduction
On December 12, 2019, the Office of the Comptroller of the Currency (OCC) and Federal Deposit Insurance Corporation (FDIC) announced their Notice of Proposed Rule Making (NPRM) to modernize regulations under the Community Reinvestment Act (CRA). This complex and comprehensive proposal would fundamentally restructure CRA and how federal examiners grade bank performance. The 120-day comment period normally allowed by the federal agencies has been abbreviated to 90 days, necessitating rapid modelling and analysis of its impact. Key features of the NPRM are its establishment of a proposed CRA evaluation measure, a retail lending distribution test and minimum community development (CD) investment thresholds. Difficulties arise from the vagueness of the proposal, necessitating assumptions and modelling under different conditions in order to predict its effects.
This report addressed the sections of the NPRM which outline the new retail lending distribution test for both home mortgage and small business lending. While the retail lending distribution test appears to be rigorous, our analysis indicated that this is deceptive. As it is currently written, it would present financial institutions, particularly large ones with nation-spanning footprints, considerable latitude in how home mortgage and small business lending to low- and moderate-income (LMI) families and communities would be apportioned. This is because an especially lenient threshold of exam failure is proposed. Under the failure thresholds suggested in the NPRM, banks could fail their retail lending distribution tests in up to 50% of their Assessment Areas (AA) and still achieve a “Satisfactory” or even an “Outstanding” rating.[1]> This is a notable change from the current rule, where all areas in which banks have a branch presence are subject to some level of review. The geographic flexibility in the pass/fail threshold would allow the largest banks to concentrate their lending and market presence in lucrative middle- and upper-income (MUI) areas, and then target their LMI lending in AAs which offer the least risk for the reward entailed. The OCC and FDIC’s NPRM would encourage the neglect of entire markets by the largest banks This analysis examined the retail distribution tests, exposed the vagueness of the proposed tests and described a scenario under which the largest banks could exploit their large market footprints to achieve a substantial competitive advantage over smaller regional banks. Finally, we introduced a five-tiered grading system which would build on the proposed geographic distribution and borrower distribution tests. Our grading system would provide better information about the performance level of banks than the proposed “pass/fail” system.
Methodology
Study Areas
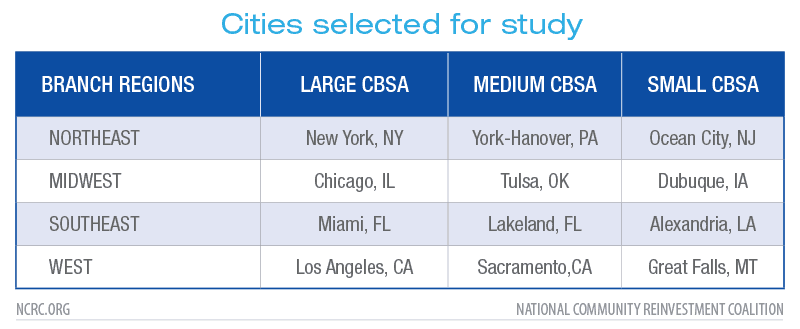
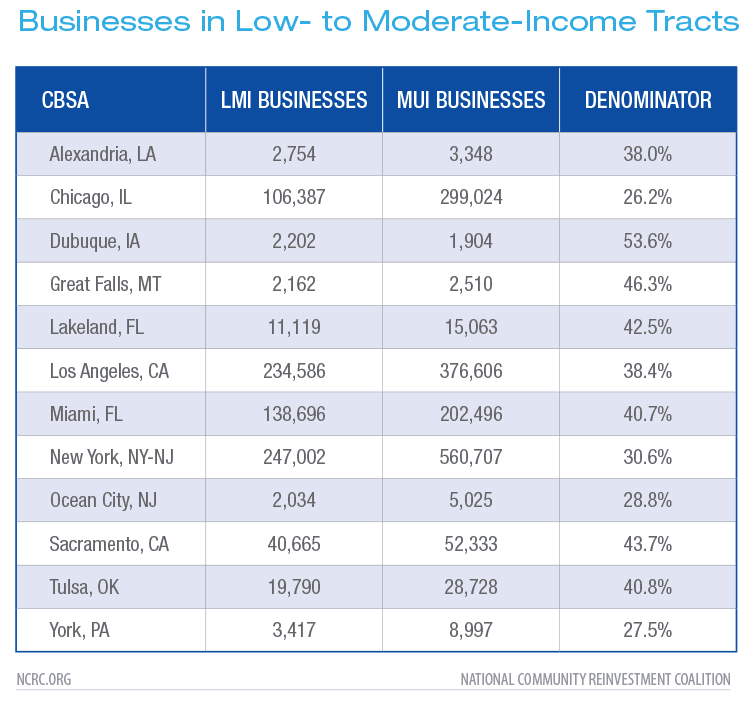
In order to model possible outcomes of the retail lending distribution test, twelve study areas were selected in a stratified random sample. The study areas were proxies for Assessment Areas (AAs) which allowed modelling of how banks within them might perform in their home mortgage and small business lending tests. We used three criteria in selecting the study areas: 1) that they were Census Bureau designated Core-Based Statistical Areas (CBSAs), 2) regional distribution, and 3) market size assessed by the number of branches within the CBSA. Regional distribution was achieved by dividing the continental U.S. into four areas: Northeast, Southeast, Midwest and West. CBSAs were then divided into three categories based on the number of branch locations: large CBSAs with over 1000 branches, medium of 100 to 999 branches and small with under 100 branches. Finally, CBSAs were randomly selected from the categories, resulting in the study areas shown in Table 1. This allowed for wide regional representation of differently sized market areas to simulate the conditions of the retail lending distribution tests.
Retail Lending Distribution Tests – Small Business and Home Mortgage Lending
The NPRM proposes to assess bank performance through performance measures, one of them being the retail lending distribution test. This test would apply to the major product lines of banks including the categories of small business, small farm, home mortgage and consumer lending. Banks would be tested in those business lines which accounted for 15% of their overall dollar volume, with an additional criteria of at least 20 loan originations in an AA. For the purposes of our model, we tested only the small business and home mortgage product lines in our study areas, applying a 20 loan threshold to qualify banks for the analysis.
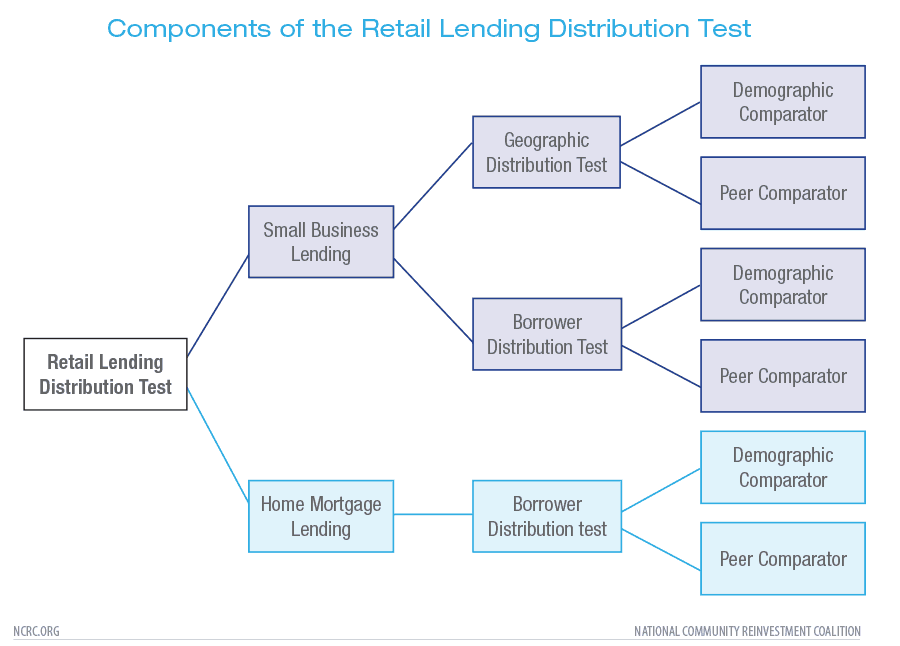
The primary components of the retail lending distribution test would be the: geographic distribution test and a borrower distribution test. For example, small business lending to LMI census tracts would be evaluated with a geographic distribution test that has two sub-tests, or comparators – a demographic comparator and a peer comparator. Business lending to small businesses is then evaluated using the borrower distribution test with the two comparators. Home mortgage lending is only evaluated using the borrower distribution test with the two comparators. Figure 1 shows the basic structure of the retail lending distribution test for small business and home mortgage lending.
Several equations outline the structure of the demographic and peer comparator tests. For the small business lending geographic distribution test, these were presented as: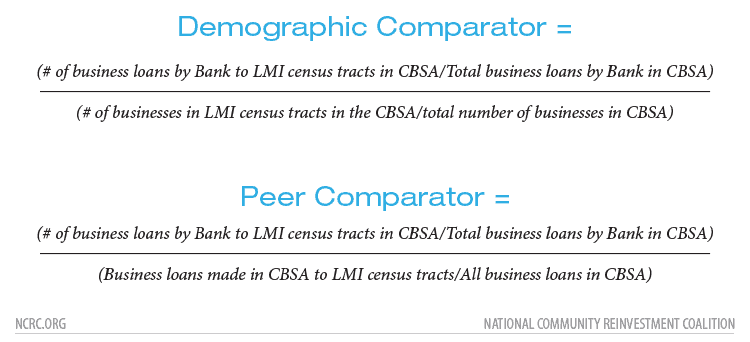
The demographic comparator would evaluate lending performance to LMI areas utilizing the overall percent of LMI tracts (roughly equivalent to neighborhoods) within the area, while the peer comparator tests the performance of specific banks relative to their peers operating in the same area. The Demographic Comparator has a 55% and the Peer Comparator a 65% threshold for passing. However, banks would need to match only one of the comparator thresholds to pass the geographic distribution test.
In addition to the geographic distribution test, there would be a borrower distribution test, with similar demographic and peer comparators, but based on the percent of loans to small businesses with revenues of $1 million or less relative to all of the small businesses operating in the area, or proportion small business loans being made in the market.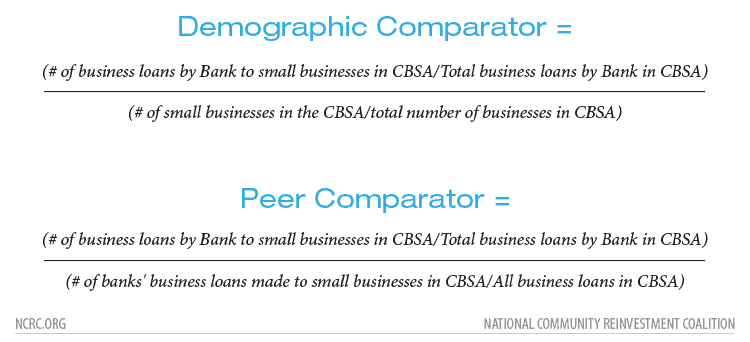
The demographic comparator of the borrower distribution test would be especially problematic due to data issues. There is no publically available data counting the number of small businesses, and the OCC and FDIC relied on private data in their estimates of that value. Additionally, comprehensive data on all business lending is not publically available (for example, there is no data on non-bank lending), requiring us to use a proxy in our modelling. Small banks and nonbanks are exempt from reporting requirements on small business lending.
As a proxy, NCRC used CRA data on lending to small businesses with revenues less than $1 million. However, we note that the agencies need to improve the dataset since they currently do not identify loans for which revenue information is not available. Being able to identify and delete loans for which revenue of the small business is not available improves the precision of the data. However, the agencies did not address this in their reform proposals. Data insufficiency was one of many problems encountered in attempting to model potential outcomes in this proposal.
Finally, for home mortgage lending, the borrower distribution test is similar to the one used for small business lending with the two component comparator equations. These are given as: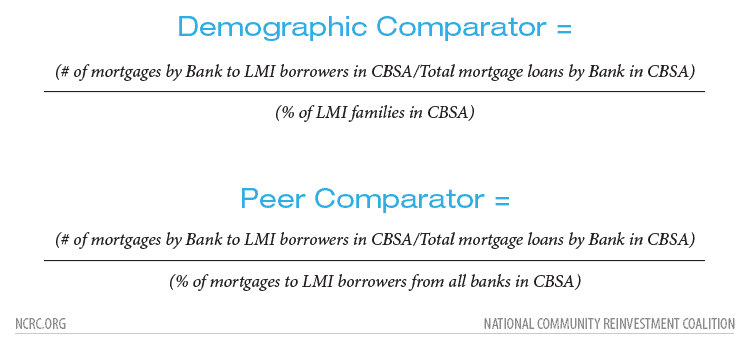 Data Sources
Data from several public sources were used to model the tests. Small business lending data was drawn from the 2017 Federal Financial Institutions Examination Council (FFIEC) CRA small business disclosure dataset, table D1-1.[2] This provides a dataset of the CRA qualified loans made by lenders at the county level. The FFIEC CRA dataset allowed us to model loans to LMI tracts within the CBSAs. In order to model the denominator of the small business demographic comparator for the geographic distribution test, we relied upon counts of open businesses from the Department of Housing and Urban Development’s (HUD) United States Postal Service administrative vacancy dataset for December 2017.[3] As previously mentioned, we were not able to model the small business lending borrower distribution demographic comparator test because there is no publically available data source with which to establish the value of the denominator.[4] For the small business peer comparator for the borrower distribution test, we used the FFIEC CRA data of qualified lending as a proxy for all business lending, though this does not capture all business lending within a market.
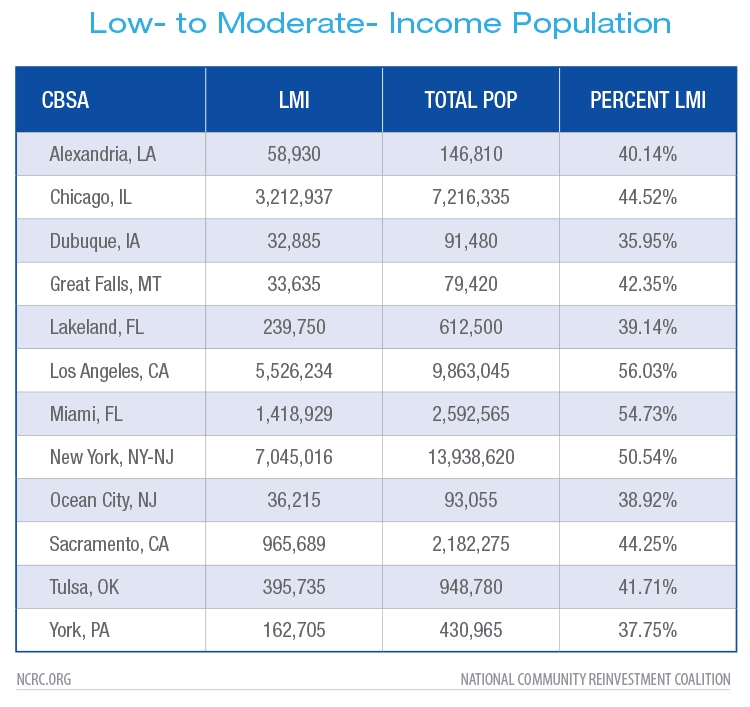
For the home mortgage borrower distribution test, the NPRM called for extensive use of data from the FDIC sourced Call Reports.This geographically detailed data is not publically available, requiring us to rely on the Consumer Financial Protection Bureau’s (CFPB) sourced 2017 Home Mortgage Disclosure Act (HMDA) home mortgage dataset.<a ” title=”” href=”#_edn5″ name=”_ednref5″>[5] The denominator of the mortgage lending demographic comparator for the borrower distribution test is the percentage of LMI families in the area, so we utilized the HUD ACS 5-year 2011-2015, Low- and Moderate-Income Summary Data.[6]<span “> This allowed us to achieve precise estimates of the percentage of LMI individuals, but not families living in our CBSA study areas.
The NPRM was vague in describing how peer groups for the AAs would be constructed. It was unspecified whether the peer group should consist of all lenders making over 20 loans within the area, or only banks with branch locations. Our model was used to calculate this in different ways, with very different results. The overall number of institutions passing or failing the peer comparator of all the tests is sensitive to how the peer group is constructed for the study areas.
Results
Small Business Lending
We found that the effects of geography and market size had a substantial impact on the results of the tests for both small business and home mortgage lending. The conditions used to establish the test group influenced the failure rates of lenders for the demographic and peer comparators. Results were particularly sensitive to whether the comparison group consisted of all lenders in the AA, only lenders with branch locations in the AA and the size of the markets. Generally, banks with branches in AAs had superior performance, larger market areas had higher overall rates of test failure and the demographic comparator had much higher levels of failure than did the peer comparator.
Banks with Branches in Assessment Area do Better in Geographic Distribution Test
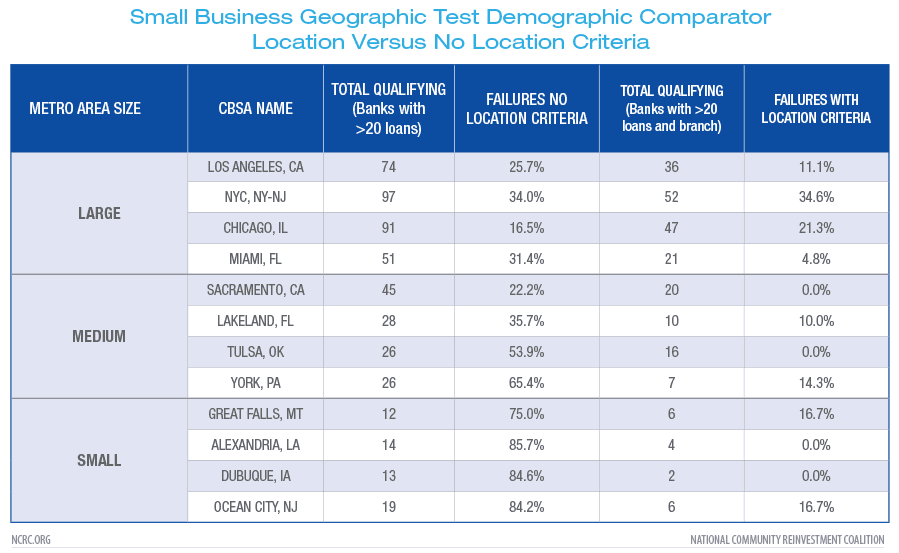
In order to account for the impact of bank branches as a determinant of lending, the tests were first run for all lenders and then only loans by banks with branch locations in the study areas.
Banks without branch locations in the AA performed much worse (Table 3). The most extreme example of this was the small business lending geographic distribution test for the demographic comparator of all lenders with more than 20 loans, regardless of whether they had a branch in the study area. For this comparator, lenders in the small metro areas had failure rates of almost 64%, followed by medium metro areas with nearly a 41% failure rate (Table 2). Large metro areas performed much better on this criteria, yet almost 27% of the lenders still failed. Overall, the demographic comparator for both small business and mortgage lending had very high rates of failure, which is discussed in detail later.

An important takeaway is that the NPRM was quite vague on the issue of how tested banks will be compared to a peer group. Will branch location remain a primary criteria for the assignment of peer groups in AAs for the retail distribution tests or will volume of lending and other indicators of market presence be used in this assignment? For the purposes of this analysis, we used the presence of a branch in the CBSA as the qualification for inclusion in the peer groups for both small business and home mortgage lending. The agencies should bear in mind that failure rates for banks in the proposed deposit-based assessment areas where they do not have branches are likely to be higher (Table 3). Testing would probably conclude that different thresholds might need to be established for deposit-based assessment areas, but the agencies have not done that to our knowledge. If banks without branches in an AA would have higher failure rates, a question for discussion during a rulemaking is whether they should have a higher failure rate or set thresholds in such a manner to, not immediately, but gradually expect them to do as well as the branch-based peers.
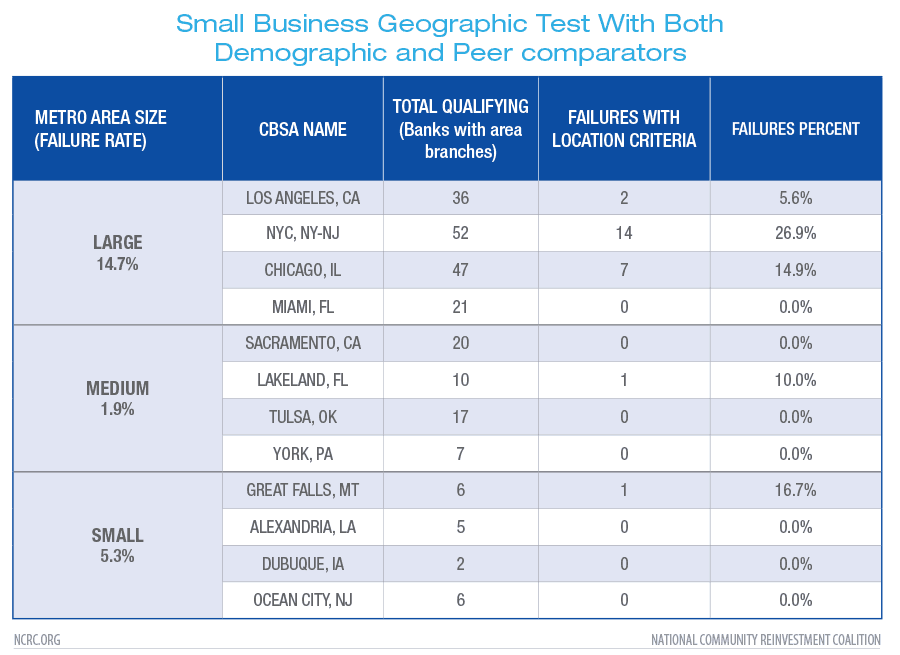
Demographic vs. Peer Comparator – Demographic is Harder for Geographic Distribution Test
The demographic comparator would be one component of the small business lending geographic distribution test. The high failure rates on the demographic comparator are tempered by the inclusion of the peer comparator test, which improves passing rates dramatically. The NPRM indicated that banks successfully pass if they met a 55% threshold for the demographic comparator. Table 3 shows the results of this. In contrast, Table 4 shows the result after both demographic and peer comparators are applied. A 65% threshold was proposed for the peer comparator. It was easier to successfully meet the criterion of the peer comparator, which was reflected in the lower rates of failure with the application of the peer comparator (Table 4). The performance of banks in small- and medium-sized study areas were greatly improved because banks scored much better on the peer comparator portion of the test than on the demographic comparator above in Table 3.
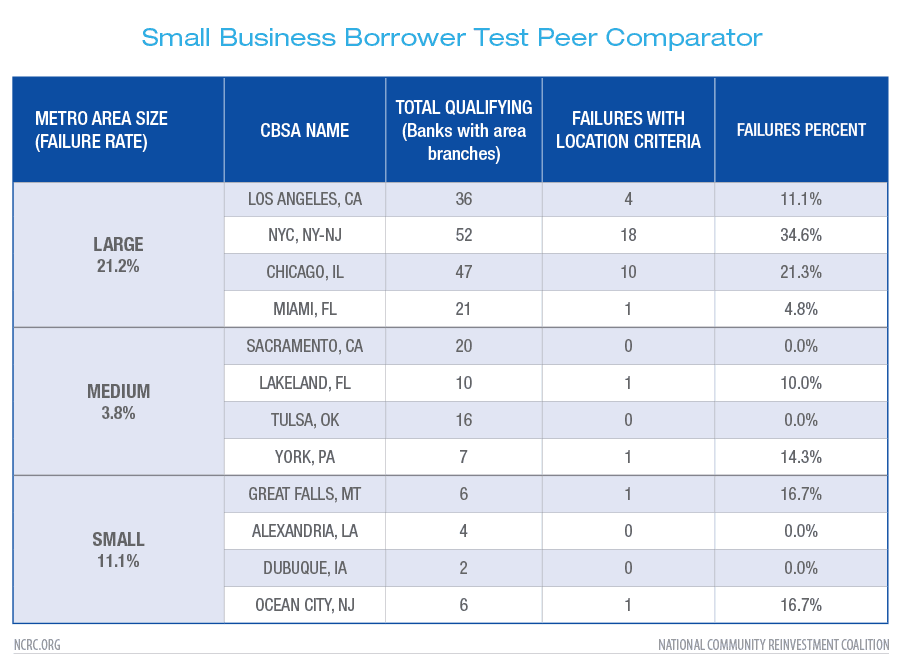
Small Business Borrower Distribution Test Shows Higher Fail Rates in Large Areas
The borrower distribution test for small business lending would not assess performance in LMI census tracts, but the proportion of small business loans to all business loans made by banks. The denominator of the demographic comparator would rely on calculation of the number of small businesses relative to all businesses in the areas, which is not available in publically available data sources. Consequently, we could not test the effect of this portion of the test. However, we could model the peer comparator portion with the FFIEC small business CRA loan data. Table 5 contains data indicating a pattern of lower failure rates for banks in medium (3.8%) and small (11.1%) areas. Once again, banks in larger areas have higher rates of failure when assessing the number of small loans made to businesses.
Home Mortgage Lending
There would be only one component to the home mortgage lending portion of the retail lending distribution test – the borrower distribution test, with its demographic and peer comparators. Banks were qualified using the same criteria as for the small business lending – 20 or more loans and presence of a branch in the area. Overall, a larger number of banks originated home mortgages than engaged in small business lending (Table 6). The greatest difference was evident in the large study areas where two to four times the number of banks engaged in home mortgage lending than in small business lending. The NPRM was unclear about the type of home mortgages that should be considered under the retail distribution test. Were they home purchase mortgages, mortgage refinancing or home improvement loans? It was never stated, so the analysis included all of these types of loans because they relate to home ownership and are secured by a residential property.
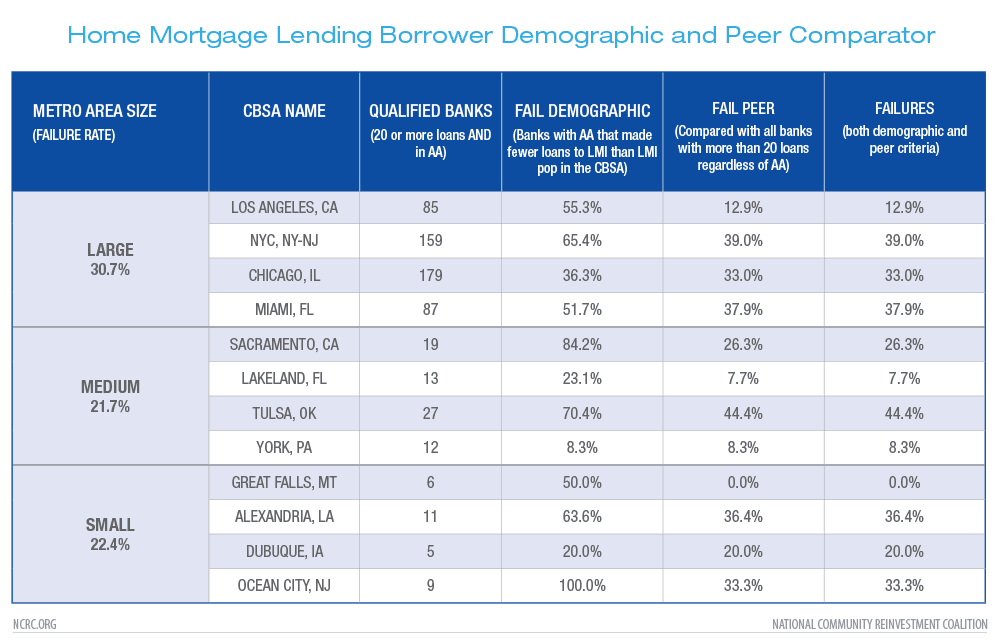
There were very high failure rates for the demographic comparator. Over half the banks (52%) failed the demographic comparator.[7] The failure rate was highest in the small study areas with an average 64% failure rate. This indicates that banks were making far fewer mortgage loans to LMI borrowers than the proportion of LMI individuals living in the area. Addition of the peer comparator mitigated this, bringing overall failure rates on the two comparators down considerably. Overall large areas fared the worst at a 31% failure level of both comparators (a bank would pass if it passes just one comparator).
Discussion
Alternative Ratings System
One difficulty with the proposed grading system would be its reliance on a “pass/fail” criteria in all of the tests. Pass/fail grading systems lower performance standards, by rewarding the bare minimum level of performance. This does not allow for a more informative system which would distinguish different levels of performance. Also, if banks were rated based on different levels of performance and the ratings were made public, banks with the lower ratings would have an incentive to improve. Pass/fail scores remove this incentive. Also, even with low failure rates, a system with enough ratings would still motivate the banks with the lowest passing ratings to improve.
With this in mind, NCRC applied the NPRM-like thresholds to a rating system. The difference was that NCRC used ranges of thresholds for five ratings. These would include passing ratings of “Outstanding” (90% and above), “High Satisfactory” (70% – 89%) and “Low Satisfactory” (50% – 69%). A contingent “Needs Improvement” grade (30% – 49%, and a failing grade of “Substantial Non-Compliance” (Below 30%) would be failing ratings. As an example, we modelled the small business geographic distribution test with the demographic and peer comparators for both the New York City-New Jersey and Sacramento, California CBSAs (Tables 7a & 7b).
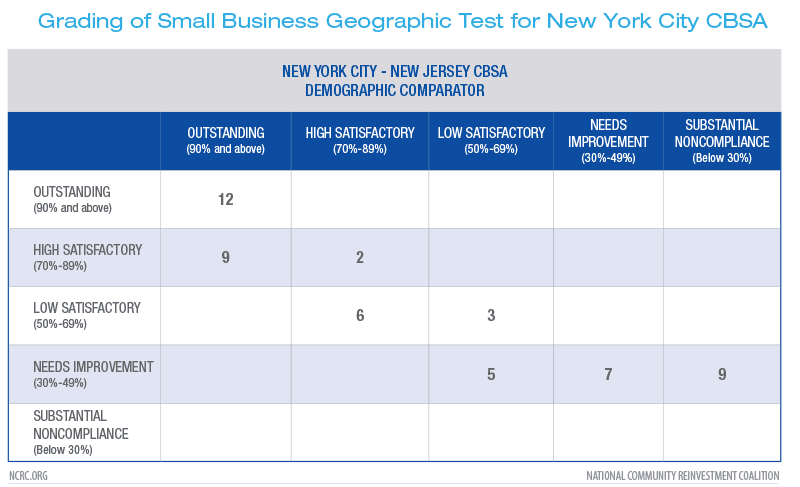
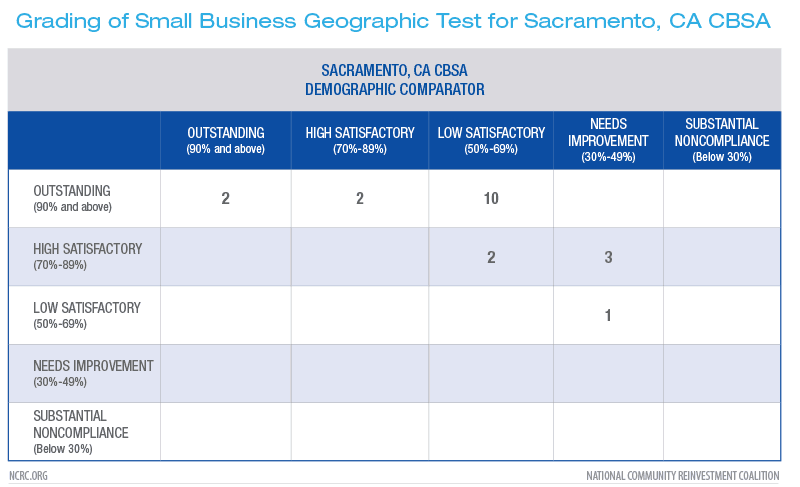
This grading system would accommodate the proposed geographic and borrower distribution tests with their AA based demographic and peer comparators. In the New York area, 21 banks would fail under the NCRC system while 14 would fail under the NPRM proposal. In the Sacramento area, four would fail under the NCRC system compared to none in the NPRM.
A number of scenarios could be devised to consider ratings on the peer and demographic comparators. One of the comparators could be weighed more heavily or a simple average could be computed. Alternatively, a bank could pass if it has a passing rating on one of the comparators. In Sacramento, this would reduce to zero the number of failing banks under the NCRC proposal. However, the NCRC proposal would have identified four banks that scored Needs to Improve or Low Satisfactory on parts of their tests. This transparency identifies partnership opportunities with community stakeholders to improve performance. Again, the agencies have not engaged the public in a thoughtful discussion by showing various scenarios like this and asking the public to comment on their benefits and costs.
Currently and in the proposed regulation, when banks receive less than Satisfactory overall, they must include in their public file a description of how they would improve their performance and update this quarterly.[8] NCRC has advocated for these types of action plans on an AA level for Low Satisfactory as well as failing performance. This requirement could turn failing or lackluster performance into a community benefit if a bank worked in a good faith effort with stakeholders including community groups in improving their performance.
Overall, the NCRC rating structure would be much more informative, and would provide the basis for more successful regulatory oversight than the proposed “pass/fail” system.
Conclusion
The proposed method of evaluating banks on the sufficiency of their home mortgage and small business lending has several deficiencies. These arise from the vagueness of the definitions outlined in the NPRM, data insufficiencies and a heavy reliance on nonpublic data sources, and sensitivities in the testing to the size and structure of the lending peer groups with which bank performance will be compared. Because of these issues, our modelling involved a number of choices impacting the size and composition of peer groups, the utilization of estimates of the number of LMI individuals rather than families. The analysis relied upon substitution of the best available alternate public data sources for the actual data called for under the NPRM.
While some components of the tests, such as the demographic comparator, seem rigorous in their assessment of a bank’s performance in meeting community need based on objective qualifiers, this is deceptive. In our model, a large proportion of banks fail the demographic comparator tests for small business and a majority fail it for home mortgage lending, but inclusion of the peer comparator as a parallel testing criteria makes this point moot. Why have a demographic comparator if the impact on performance assessment is nullified by the peer comparator? Our models also show that the peer comparator is very sensitive to the size of the peer group, and that the demographic comparator is sensitive to area size, which is expected to carry-over to the AAs used when evaluating bank performance. Generally, the models demonstrated that small and medium sized metro areas had lower rates of exam failure than larger metro areas did. This creates a troubling dynamic that could be exploited by banks with large geographic footprints and numerous AAs.
The NPRM proposes a 50% of AAs failure threshold[9], allowing banks to fail the retail lending test in half of their markets. A wide failure threshold would give the largest banks considerable discretion in how they could direct their CRA investments. Hypothetically, an expansive, economically diverse metro area with great economic inequality like the New York-New Jersey CBSA in which banks performed poorly in our model could be “surrendered” by the largest banks as a failed AA. This would allow large banks to direct their LMI lending resources to more easily managed and smaller AAs, while maximizing lending to the more lucrative middle- to upper-income (MUI) borrowers and neighborhoods in large CBSAs like New York.
In contrast, smaller regional banks without a large national footprint have less flexibility in choosing AAs in which to concentrate LMI lending, putting them at a competitive disadvantage under this scenario. Because of this “allowance for failure,” large banks would be motivated to concentrate LMI lending in small to medium markets, while poaching the most lucrative MUI customers of large metros. This element of the proposal is almost designed to fail in meeting credit needs for LMI borrowers and communities in large metro markets. It could lead to the abandonment of lending in the LMI areas of entire metro area markets by large banks. Further refinement of the thresholds is imperative to avoid this adverse outcome. If the agencies finalize the NPRM as proposed, they would cause the likely abandonment of LMI lending in the largest and most expensive metropolitan areas by the largest banks.
The vagueness of the proposal makes it difficult to determine whether a failure in an AA on a retail test would disqualify the activities from contributing to the CRA evaluation measure. In other words, if a bank fails on the retail test in the NY CBSA, the NPRM seems to read that its activities would still count in the numerator at least for the bank level CRA evaluation measure. This promotes gaming. A bank can conclude that it will fail in the NY retail test but still count its retail loans in the CRA evaluation measure as well as some large infrastructure financing.
Appendix
[1] A 50% of assessment area failure threshold is proposed in the NPRM, however this is a suggested level which the agencies seem prepared to adjust in the final rulemaking.
[2] CRA Aggregate and Disclosure Flat Files, https://www.ffiec.gov/cra/craflatfiles.htm
[3] HUD Aggregated USPS Administrative Data on Address Vacancies, https://www.huduser.gov/portal/usps/home.html
[4] Joint Notice of Proposed Rulemaking (NPRM), OCC & FDIC, Federal Register, Vol. 85, No. 6, Thursday, January 9, 2020, pg. 1220.
[5] CFPB Download Historic HMDA Data, https://www.consumerfinance.gov/data-research/hmda/historic-data/
[6] HUD Exchange: ACS 5-Year 2011-2015 Low- and Moderate-Income Summary Data https://www.hudexchange.info/programs/acs-low-mod-summary-data/
[7] The demographic comparator failure rate was over 90% when examining all lenders in the markets with 20 or more loans and before the branch location criteria was applied.
[8] NPRM, p 1251.
[9] The NPRM suggests that this level of failure is simply a proposed amount, that is subject to public comment and amendment.
