Defining Latino
The terms Hispanic and Latino are often used interchangeably, with most US statistics counting both Hispanic and Latino as one category. However, “Hispanic” and “Latino” have different definitions and describe different groups of people. It is important to remember that, while these are widely used terms, the acceptance or use of the “Hispanic” or “Latino” label is different for every individual. Hispanic is the term describing any individual from Spain or a Spanish-speaking country. In the United States, it is most often thought of specifically as a person who is from or has ancestry in a Spanish-speaking Latin American country.
The term Latino, shorthand for “Latinoamericano,” refers to any individual born or descended exclusively from countries in the Americas (including the Caribbean) that widely speak Latin-based languages such as Spanish, French, or Portuguese.
In this publication, we primarily use the term Latino because of our focus on people from Latin America. The census defines “Hispanic or Latino” as a person of Cuban, Mexican, Puerto Rican, South or Central American, or other Spanish culture or origin – regardless of race. Since we use mostly census data, the Latino information we have mostly derives from people who are born in or have ancestry from Latin American Spanish-speaking countries, and often does not include people from Haiti, Brazil and Spain.
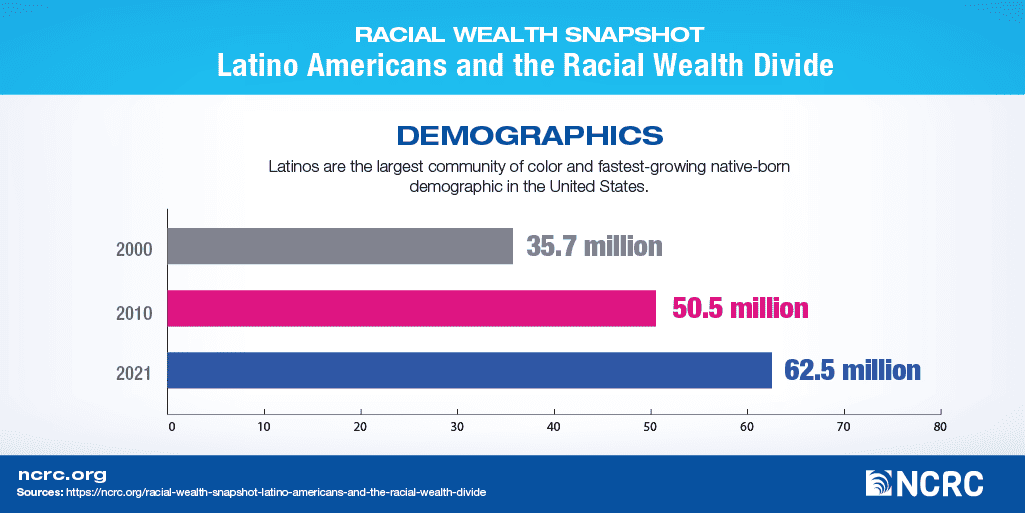
Demographics
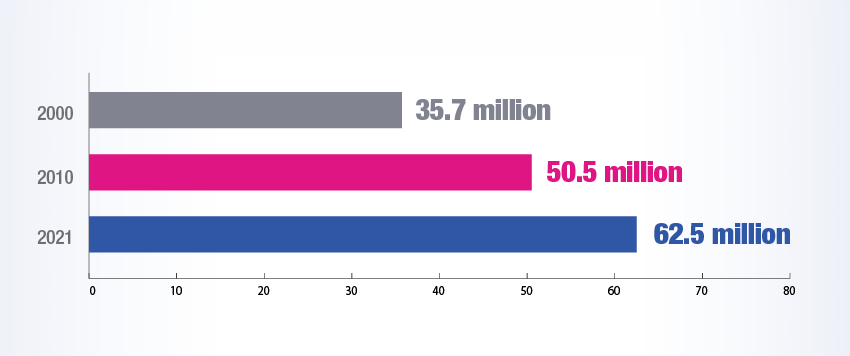
Latinos are the largest community of color and fastest-growing native-born demographic in the United States.
In 2000, there were about 35.7 million Latinos in the country. By 2010, the population grew 42% to 50.5 million. Latino population growth continued over the past decade, rising by about 24% to 62.5 million in 2021. In 2020, Latinos represented 18.7% of the US population, accounting for about half (52%) of total US population growth over the decade. Latinos have a greater share of the growth than any other racial or ethnic group.
Individuals that identify as Latino can be of any race. The number of Latinos who say they are multiracial has increased from 3 million in 2010 to 28 million in 2021. However, unlike other demographic increases for the Latino community, the dramatic increase in multiracial identities could be due to a number of factors, such as changes to race and ethnicity questions for the 2020 Census.
As of May 2023, the US Census’s Current Population Survey (CPS) estimated that about 60.5% of Latinos are of Mexican descent, 8.6% are Puerto Rican, 7.9% identify as South American and 10% identify as Central American.
The majority of the US Latino population was born in the United States. As of 2019, about one-third of all Latinos in the US were born outside of the country, a total of 19.8 million. The share of the Latino population which is foreign-born has declined by about 17% over the past decade — from 40% in 2000 to 33% in 2019.
Young Latinos specifically are the fastest-growing demographic. Between 2010 and 2022, the Latino population added around 12.9 million people to the total population, 2.9 million of whom were under the age of 25. Latino population growth is almost entirely driven by the native-born: From 2020 to 2021, there were 940,000 Latino children born in the country, compared to 90,000 individuals immigrating to the US.
In 2017, the Hispanic Research Center found that half of Latino children have at least one parent who was born in another country, and about one quarter have a parent who lacks legal status to live in the United States. Undocumented individuals like those parents are not directly counted by the U.S. Census and can only be estimated, making precise statistics on the undocumented share of the Latino community hard to gauge. Despite the difficulty, the American Community Survey (ACS) and the Department of Homeland Security (DHS) in 2019 estimated that 13% of the total Latinoamerican community, and 35.2% of the Latino immigrant population are undocumented.
Debt, Inheritance, Wealth & Homeownership
The US Census Bureau defines household wealth as the value of assets owned minus the debts owed. In 2021, the median wealth of a Latino household was $48,720, which is only about 20% of non-Hispanic White households’ median wealth of $250,400.
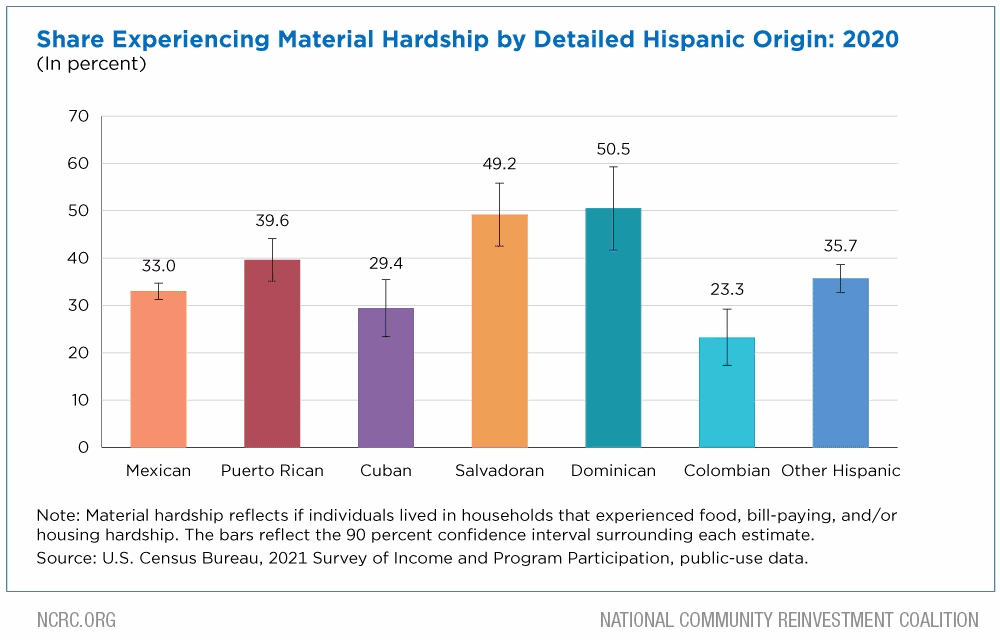
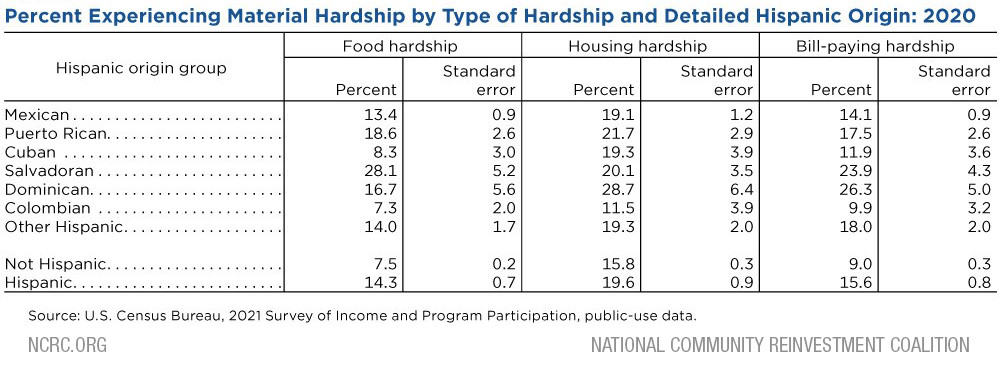
Separate Census data on material hardship, defined as a household experiencing one or multiple hardships relating to food, bill paying or housing, reveals further inequality. More than 1 in 3 Latinos in the US lived in a household that experienced material hardship in 2020.
Because the Latino community encompasses a diverse range of origins, no singular value for wealth across the Latino community shows the full picture. Research done by the American Community Survey (ACS) found that differences in wealth within the community can be attributed to variations between the communities in educational attainment, types of jobs held or available to them, ability to speak English, living arrangements, location, citizenship status and race identity.
The US Census Bureau’s Survey of Income and Program Participation (SIPP) found the highest rates of material hardship within the community among those of Salvadoran (49.2%) and Dominican (50.5%) heritage. Those of Colombian heritage had the lowest rate of material hardship among Latino subgroups at 23.3%.
Across the Latino community, there were also variations in ability to accumulate wealth. Latinos with Colombian origins had the highest median household wealth, totaling $141,200, whereas Latinos of Dominican origins had the lowest median household wealth at $9,430. All median household wealth totals across the various Latino origins were less than the median household wealth of the non-Hispanic community at $195,600.
Gaps in generational wealth accumulation also contribute to the inequalities Latinos experience. The wealth disparity between Latinos and non-Latinos corresponds with a strong inheritance disparity. Research from the University of Pennsylvania published in 2021 found that, across all ages and survey fields, non-Hispanic White households inherited over six times the amount inherited by Latinos households. Across all ages and survey years, non-Hispanic White individuals had a 9% chance of receiving an inheritance, Latino individuals had a 2.1% chance.
The Latino populace still trails other groups in homeownership by dramatic margins: In the first quarter of 2023 the homeownership rate for Latino Americans was 49.7%, lower than the national homeownership rate of 66.0% and significantly lower than the non-Hispanic White American homeownership rate of 74.4%. Although the homeownership rate for all groups fluctuates year to year, homeownership rates for Latinos have been constantly below both the overall national level and the non-Hispanic White level.
Bleak though these gauges of Latino economic security are, there is also brighter news in data on homeownership. Latino homeownership rates have grown steadily in recent years – and at rates that exceed the growth in non-Hispanic White homeownership in some cases – thanks to strong annual raw-number gains. In 2022 a net total of 349,000 Latino homeowner households were added according to research compiled by the National Association of Hispanic Real Estate Professionals (NAHREP). The Latino community in the United States added 2.3 million homeowner households from 2014-2022, NAHREP determined from Census data. 2022 specifically was the year of the largest growth in Latino homeownership in over a decade, more than double the growth of non-Hispanic White households.
Latinos are also buying homes at younger ages than other groups. Some 70.6% of Latinos who purchased a home with a mortgage in 2021 were under the age of 45 – well above both the overall figure (63.9%) and that for non-Hispanic White buyers (61.5%). While the COVID-19 pandemic hit the Latino community especially hard, those years were also a period of significant homeownership growth. The Urban Institute found that the primary drivers of this growth were young, high-earning and highly educated borrowers, many of whom took advantage of historically low interest rates caused by the COVID-19 pandemic.
The numbers are also promising on debt. In 2021, Latino households carried a lower median total debt value compared to other demographic populations, including White people. Latino households owed a median debt of $37,900, non-Hispanic Black households owed $27,000, non-Hispanic White families owed $77,800 and non-Hispanic Asian households owed the highest median debt at $133,000. When compared to the non-Hispanic population, Latinos in the United States have 54.1% less debt. Though Latinos carry lower levels of debt, it is proportional to the median household wealth and income.
Educational Attainment
Education is an important intangible asset. Higher education particularly is linked to stronger socio-economic outcomes. In the Latino population, educational attainment has been on the rise over the past decades. From 1996 to 2022, the share of the age 25-29 Latino population that had graduated from high school increased from 52% to 88%, according to Census data.
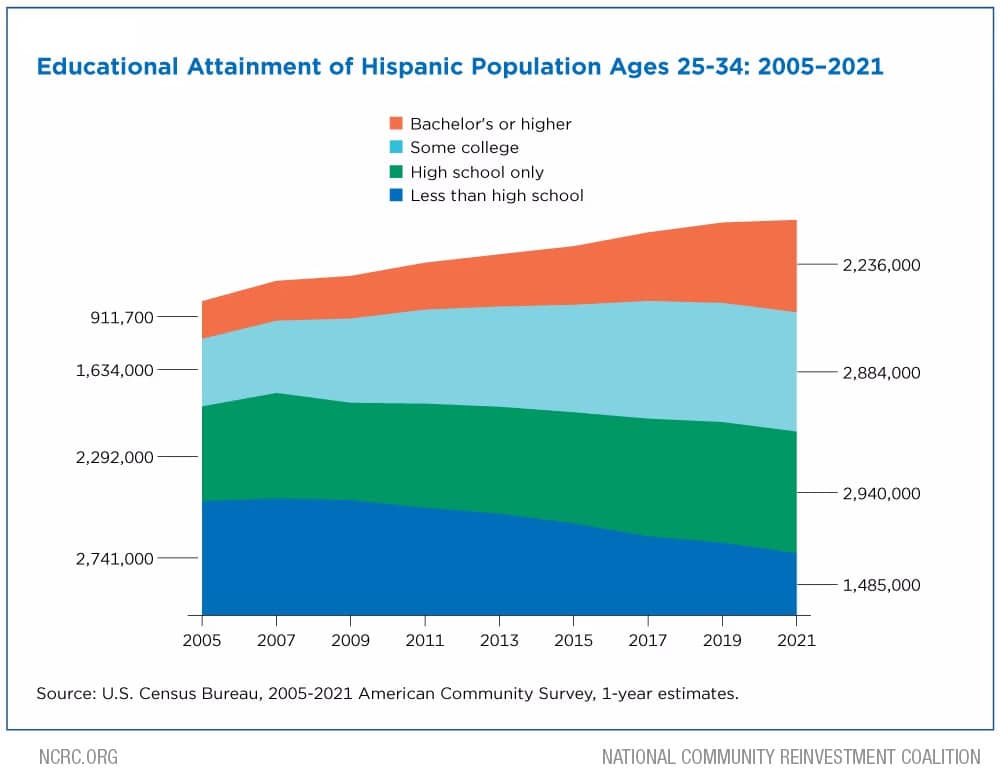
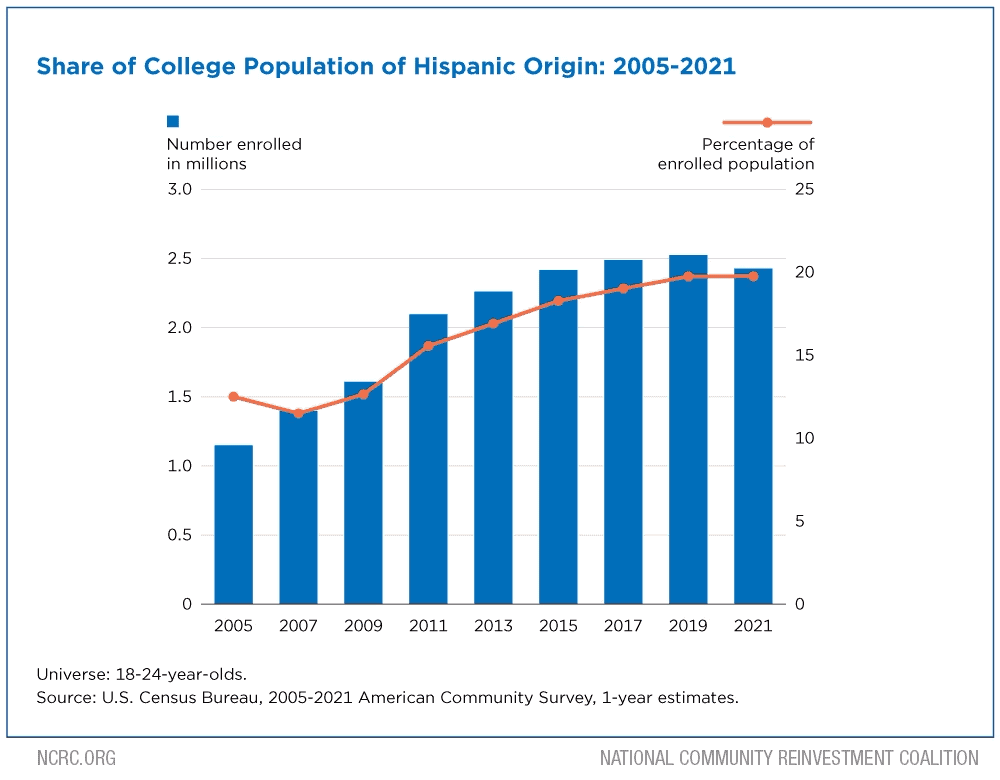
For Latino students 18 to 24, college enrollment numbers doubled, going from 1.2 million in 2005 to 2.4 million students enrolled in 2021. In 2021, Latino students represented 20% of all students enrolled in college.
Latinos have the lowest attainment of bachelor’s degrees or higher of any major racial or ethnic group in the US. Just 14.5% of Latino individuals aged 25 years or older had attained a bachelor’s degree, according to the US Census Bureau’s 2022 data release on Educational Attainment in the United States. In contrast, 26.1% of non-Hispanic White individuals, 17.1% of non-Hispanic Black individuals, 32.6% of non-Hispanic Asian individuals and 23.4% of the US overall had attained a bachelor’s degree. Financial constraints, including the cost of college and the need to support their families, are major barriers for many Latinos when deciding to enroll or complete college.
Within the Latino population, from the years 2005 to 2021, all groups experienced growth in college enrollment. Latino groups with Cuban and South American origins initially had higher college enrollment rates, but had small increases. In contrast, other groups with origins in Mexico, Puerto Rico, the Dominican Republic and Central America had lower initial enrollment rates, but experienced significant gains.
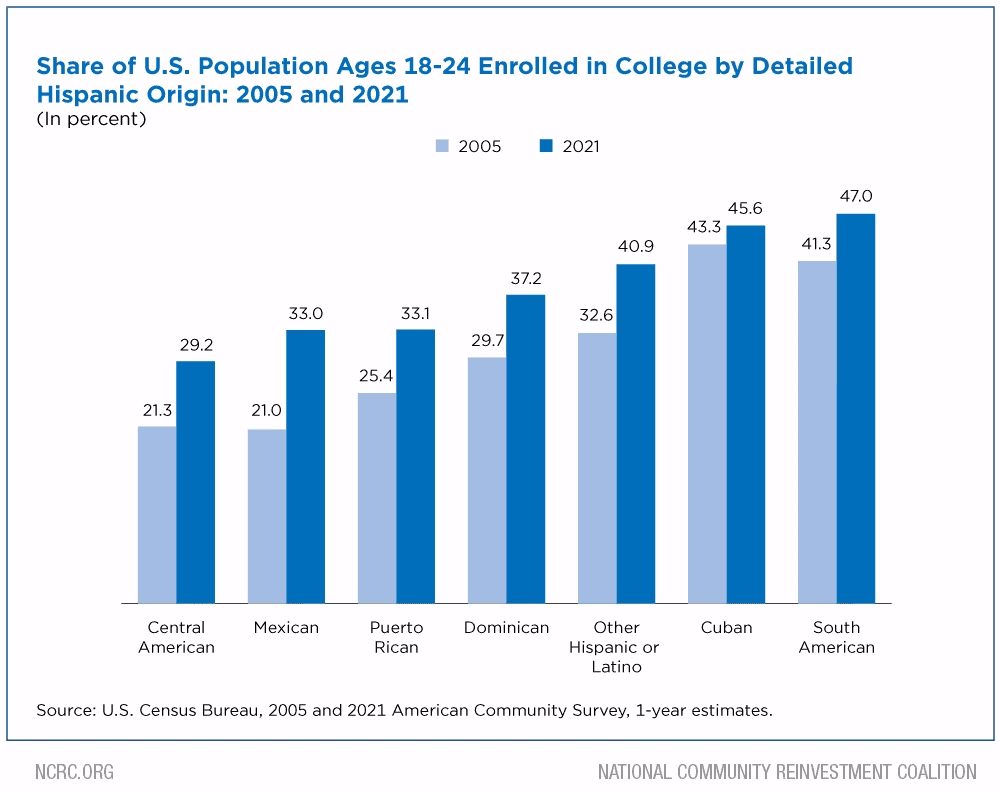
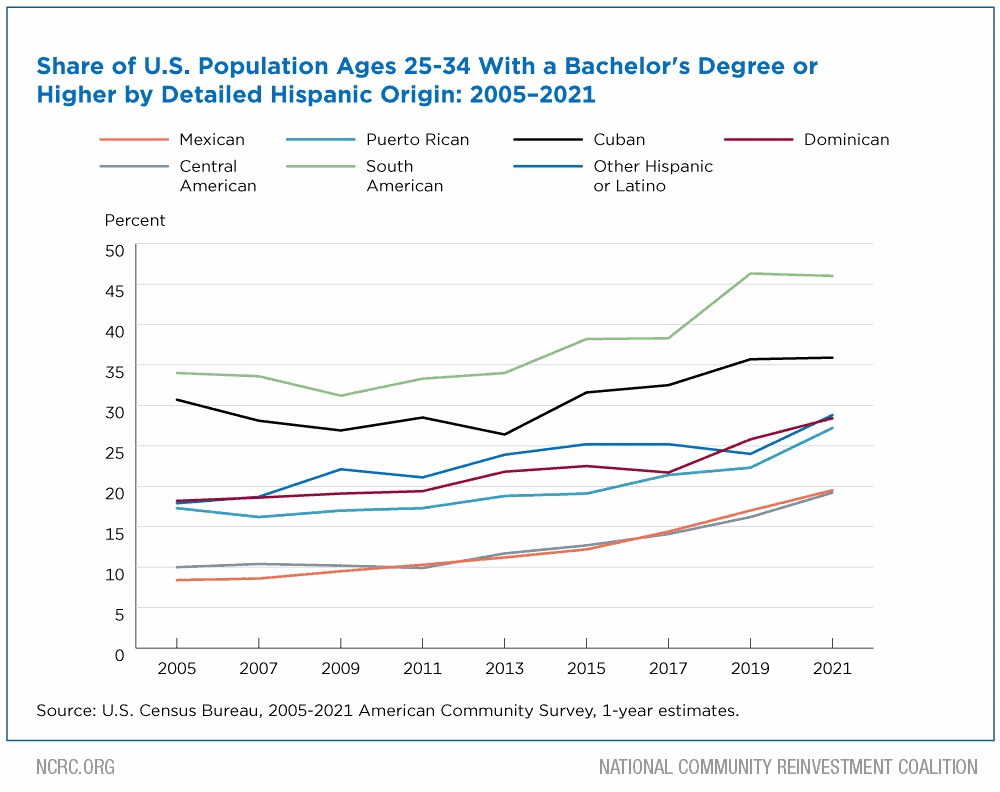
Latino individuals with Mexican origins exhibited the largest increase from the 2005-2021 period, with a 12 percentage point increase from 21% enrollment to 33% enrollment. Latino individuals with South American origins had the highest levels of bachelor’s degree attainment at 46%, followed by those with Cuban origins at 35.9%.
In 2017, US-born Latinos aged 25 or older had higher educational attainment than their foreign-born counterparts, with 20% of Latino individuals born in the US having a bachelor’s degree or higher, compared to 12% Latino individuals born outside of the US. However, Latinos who have immigrated within recent years have higher education levels than previous immigrants. About 26% of Latinos 25 years and older who immigrated to the US between 2012-2018 had a bachelor’s degree.
Poverty Rates
The United States Census Bureau defines poverty using an income threshold that varies by size of household. In 2021, 17.1% of the Latino population within the US was in poverty, more than double the 8.1% poverty rate among the non-Hispanic White population. In addition, while Latino individuals in the United States make up 19% of the population, they are overrepresented in the population in poverty, comprising 28.2% of people in poverty in the US.
Latino poverty rates have been on the decline over the past 40 years, aside from inflections mirroring national poverty trends such as in the wake of the great recession. Latino poverty rates have declined significantly since 2010, decreasing from 26.5% to 17.1% in 2021.
Income, Employment & Unemployment
The growing US Latino population is one of the most socioeconomically insecure demographic groups in the country. For example, the Latino community holds a significant share of low-wage and essential jobs and is overrepresented in the industries most affected by the COVID-19 pandemic, such as leisure, hospitality and construction.
According to a brief put out by the US Census Bureau, the median household income for Latino households increased by 2.7%, from $58,984 in 2019 to $60,566 in 2021. In 2021, non-Hispanic White individuals had a median income of $75,412, which is 24.5% more than the Latino household median income.
Since the COVID-19 pandemic raised joblessness numbers for the Latino community, the unemployment rate has seen steadily decreasing numbers. From 2022 to 2023, the Latino unemployment rate decreased from 4.1% to 4.0%, with the national unemployment rate dropping by the same 0.1 percentage point to 3.4% in that span. Native-born Latinos had an unemployment rate of 4.8%, whereas foreign-born Latinos had a lower rate of 3.7%, according to the Bureau of Labor Statistics (BLS).
The labor force participation rate (LFPR) measures a different aspect of the job market from the topline unemployment rate. Where unemployment measures the share of those seeking work who are unable to get it, LFPR gauges how many members of a given group are seeking work regardless of their employment status. Non-Hispanic White individuals had a 61.5% LFPR, nearly identical to the non-Hispanic Black LFP of 60.9%. Latino LFPR is substantially higher at 65.5%, due in large part to the relative youth of the population.
According to 2021 BLS data, the Latino community makes up 18% of the United States total employment, compared to the non-hispanic White share of total employment of around 62%. The latino community is projected to account for 1 out of every 5 workers (21.2%) in 2030, and out of the 18% of Latino individuals in the workforce in 2021, 9 in 10 (89%) were White.
For their 18% share of total United States employment, the Latino community made up a larger share of some of the detailed occupational categories than would be proportional to their total share of employment. For example, the Latino community make up 49% of construction laborers, 48% of housekeepers, and 47% of landscape workers, yet only make up 7.4% of chief executives, 5.8% of software developers, and 5.1% of industrial engineers.
Within the Latino community, data from the Current Population Survey (CPS) showed that 16.7% of employed Latinos work in production, transportation and material moving; 17% in natural resources, construction and maintenance related occupations; 19% in sales or office related occupations; 22.9% in a service related occupation; and 24.5% in management, professional and related occupations.
Latinas & Gender Inequality
Latinas, a term denoting women in the Latino community, face a significant income disparity in comparison to Latino men despite being more likely to go to college and earn a degree. The Pew Research center found that 35% of Latinas age 18 to 24 were enrolled at least part time in college in 2021, compared to 28% of Latino men in the same age group. More Latinas also hold college degrees (27%) compared to Latino men (20%).
However, like women in other major racial and ethnic categories, Latinas still did not earn as much as Latino men. The US Census’ historical income tables report for 2021 found Latinas had a median income of $25,324 versus $36,334 earned by the median Latino man. In the third quarter of 2021, median weekly earnings among full-time Latina workers were $723, while Latino men made a median wage of $826 per week. As the Latino population continues to grow, a wage gap will only hinder the group from reaching its full economic potential.
Latinas age 16 and older had an unemployment rate of 7.2% in 2021, according to a BLS analysis, while Latino men of the same age range had a 6.5% unemployment rate. There are significant major disparities in LFPR between men and women in the Latino community. Latinas’ 2021 LFPR was 55.8% while their male counterparts participated in the workforce at a higher rate at 75.4%. For comparison, the nation’s overall LFPR is 61.7%.
Latinas are also more vulnerable to experiencing poverty. One million Latinas who are the head of their household currently live in poverty, a report from UNIDOS and the National Partnership for Women and Families noted. Closing the wage gap for the Latino community as a whole and women in particular would provide Latinas with additional income to support their families and make critical investments.
