Introduction
The National Community Reinvestment Coalition has analyzed new data available to researchers for the first time to determine borrower patterns among same-sex couples, in comparison to different-sex couples. Our research question was, will same-sex couples pay higher closing costs and more interest on mortgage loans than different-sex couples?
From our analysis of 2018 Home Mortgage Disclosure Act data (HMDA), we found a consistent pattern of higher costs both in closing fees and interest rates for same-sex borrowers.
We also found:
- Same-sex couples were more likely to be minority, lower-income and younger than their different-sex counterparts.
- Same-sex couples were also more likely to seek loans from mortgage companies than banks or credit unions.
- Same-sex couples generally could expect to pay higher closing costs and were charged interest rates that exceeded those charged to different-sex couples.
- Same-sex couples were more likely to have their home loans denied and were less likely to see their application for a home purchase loan result in an origination.
According to the Williams Institute of UCLA, a leading researcher of LBGTQ+ issues, there are currently 700,000 co-habitating same-sex couples in the United States. About 4.5% of Americans identify as a part of the LGBTQ+ community (lesbian, gay, bisexual, transgender, queer/questioning and other members of the community), up from 4.1% in 2016, according to a 2017 Gallup study. That percentage also represents an increase in self-identification from 2012, likely pointing to the implications of recent civil liberties gains. On the heels of state-based marriage equality, analysis by the U.S. Department of Housing and Urban Development (HUD) points to increases in the number of same-sex mortgage applications. With national marriage equality confirmed in 2015 via Obergefell v. Hodges, 574 U.S. 1118, same-sex mortgage applications continue to grow given the expanded options and protections newly afforded to same-sex couples.
The LGBTQ+ community, by and large, aspires to homeownership with relatively equal percentages of people who identify as lesbians (74%) and gay men (73%) preferring home ownership over renting. Bisexuals and Gender Expansive self-identified respondents reported that preference at 68% and 66%, respectively, according to the National Association of Gay & Lesbian Real Estate Professionals.
There is very little published research on same-sex lending, but among the literature that is published data analysis suggest that same-sex couples are more likely to be denied a mortgage or pay more for the loan they do get. In this report we reviewed the recently released HMDA data using new variables on closing fees and loan price to delve a bit deeper on same-sex lending and contribute to the lending research of the LGBTQ+ population. In addition, we reviewed this data for other factors that might account for differences in origination rates and loan costs.
Data and Methods
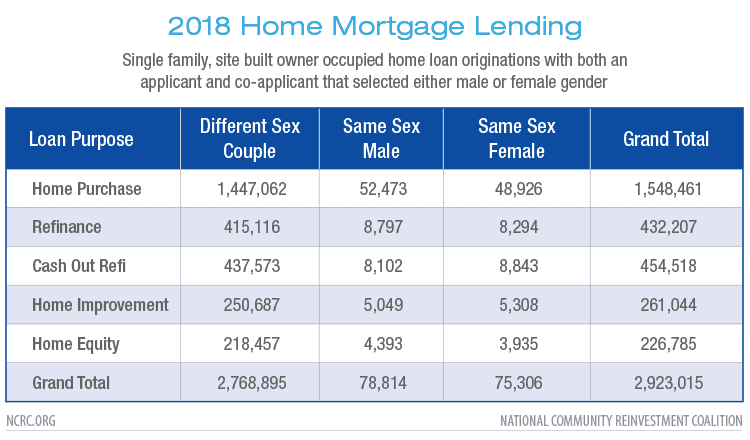
In 2018, the Consumer Financial Protection Bureau (CFPB) reported that HMDA data included a little over 6.75 million home purchase loans originated by lenders to owner occupants. In the vast majority of cases, the data includes both the gender of the applicant and co-applicant.
We have identified loan records where applicants identified a gender and grouped them based on the presence and gender of the co-applicant, excluding records where no gender was identified leaving just over 6.3 million loans. Excluding loans with no co-applicant, we were left with a total dataset of a little less than 3 million loans across all loan purposes. While there is still no perfect way to identify same-sex couples that are in a spousal or committed relationship using this dataset, our analysis replicated the methodology most often utilized in similar studies of same-sex mortgage co-applicants. This data does not allow us to identify the sexual orientation of loan applicants, but simply the gender that is identified by the applicants.
However, the 5% of loans to couples that were made to same-sex applicants is roughly analogous to the percent of the population that identifies as LGBT. This suggests that most of the loans identified this way are to same-sex couples in spousal relationships.
While same-sex couples represented a fraction of total mortgages in the United States in 2018, marriage legalization in 2015 and changing societal norms has contributed to a steady increase of LGBTQ+ households. Presumably that number will continue to grow with greater societal acceptance and increased self-identification. Of those in Generation X, 65% identify as hetrosexual, compared to 48% of Millennials and 48% of those in Generation Z.
Results
Home Purchase Lending
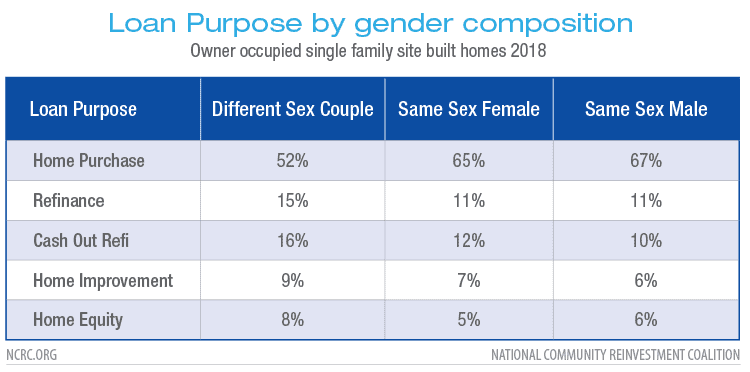
Home purchase lending was more common among same-sex couples than refinance or home equity lending. 65%-67% of all loans to a same-sex couple were for home purchase loans, compared with just 52% of different-sex couples.
In general, same-sex couples were more likely to buy homes in low- and moderate-income (LMI) and majority minority [1] neighborhoods. They were also more likely to be people of color themselves and female same-sex couples were more likely to be LMI. There are suggestions in some sources that same-sex couples are more likely to be more diverse in both race and age than different-sex relationships. In the following sections of this report we focus on home purchase lending to better understand the differences between different-sex couples as well as male and female same-sex couples.

Age, Race, Income, and Lender Type in Same-Sex Lending
Mortgage borrowers from LMI or minority communities face immense structural hurdles to the home loan process. Buying a home requires a substantial amount of wealth to begin with, even when using loan products insured by the government intended to support first-time home buyers. For borrowers from communities historically excluded from home ownership this burden is particularly difficult. Often the official segregation of federal, state and local policies enshrined segregation at the local level, limiting the possibility of home ownership for marginalized communities.
In the sections below we look at the likelihood that borrowers from both male and female same-sex couples faced greater challenges than different-sex couples in the mortgage market. We focused on the cost of home purchase lending for these couples as well as the origination and denial rates for their applications. We looked at both of these measures compared with the borrower age, race, and income as well as the type of lender they used to fund their home purchase.
Borrower Age
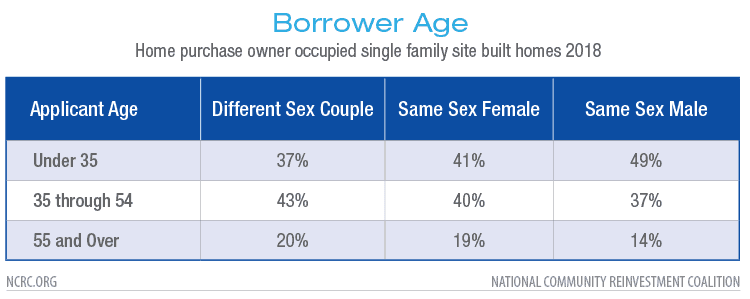
Borrower age is a structural barrier common to first time buyers, as younger applicants frequently are less financially stable than older applicants. Younger borrowers often lack existing home equity that they can roll into a new purchase.
This is important for this discussion because same-sex borrowers have a clear tendency to be younger than their different-sex counterparts. This is particularly visible in same-sex male applicants, where 49% of them in 2018 were under the age of 35 compared with just 37% of different-sex couples.
Borrower Race
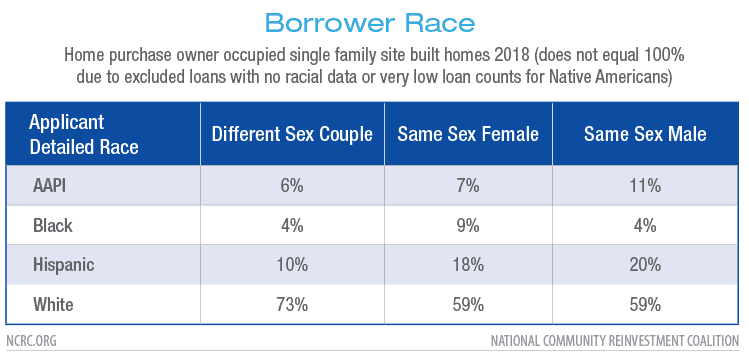
Same-sex couples are much less likely to have a White applicant than different-sex couples. 73% of different-sex couples had a White applicant in 2018, compared with 59% of same-sex couples. Given the structural barriers that race imparts for home buyers and mortgage applicants in the U.S. this difference in the race of the same-sex home buying population will likely have an impact on the cost and origination rate of loans to same-sex borrowers.
Borrower Income
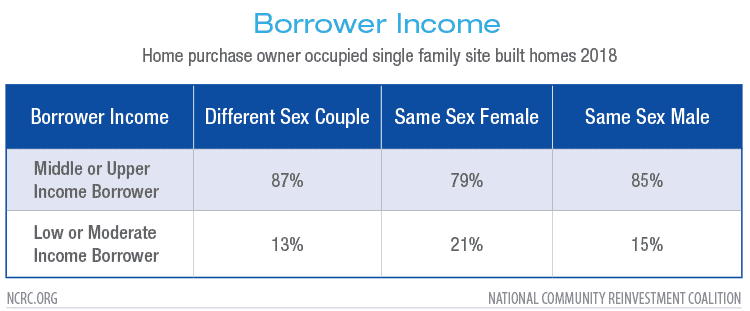
Borrower income often limits the price a homebuyer can afford, which can result in a series of other consequences as lower-income borrowers often incur additional fees, higher interest rates and more chances that their loans will be denied.
While same-sex male couples tend to report a similar share of LMI lending as different-sex couples we found that 21% of same-sex female couples were LMI compared to same-sex male couples (15%) and different-sex couples (13%). The gender gap in incomes can limit the purchasing power for same-sex female couples.
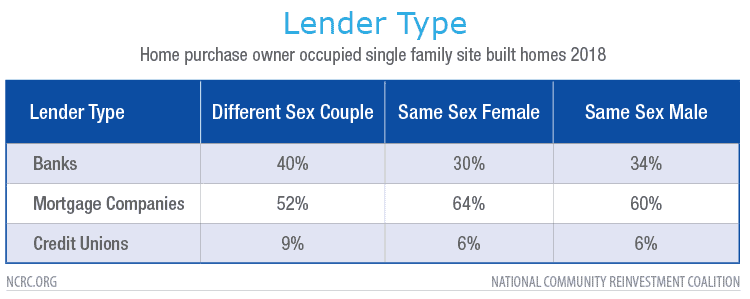
Lender Type
Mortgage companies, banks and credit unions all offer mortgages for home buyers but they are not all the same nor do they necessarily offer the same products. Mortgage loans are broadly limited main products. Conventional loans are mortgages made by banks without any additional insurance in case of default. They tend to offer lower rates and closing fees in exchange for requiring more money for down payment and better credit. The FHA loan program administered by HUD offers loans insured by the Federal government, in case of default the principle of the loan is paid to the lender. Lowering the risk in this way allows these loans to offer smaller down payments but the closing fees and interest rates associated with them are often larger than conventional loans. The Veteran’s Administration and the US Department of Agriculture also offer loans programs for Veterans and rural communities that are relatively low cost and allow borrowers to purchase a home with no down payment.
These distinctions are important. Since the Great Recession from 2007-2009, banks have largely withdrawn from the FHA/VA/RHS market. Although there are conventional loan products such as the Fannie Mae Home Ready program that mimic the low down payment requirements of the FHA program they have not proven to be as popular as FHA loans with borrowers and loan originators. Therefore, borrowers that are more likely to need an FHA loan, who are disproportionately younger/first-time borrowers and LMI or minority, are often unable to secure home mortgage financing through a bank or credit union.
Mortgage companies consistently report both higher interest rates and closing costs on the loans that they make. In 2018 when looking at all home buyers who used a mortgage company to fund their purchase we found that they paid an average of $2,100 more than those borrowers who used a bank and $2,800 more than credit union borrowers. Since mortgage companies are the primary source for loans needed by younger borrowers they are often over-represented in the loan applications to those borrowers. Not surprisingly, we found that same-sex couples are more likely to use mortgage companies to fund their purchases, with 64% of same-sex female and 60% of same-sex male couples using a mortgage company compared with just 52% of different-sex couples. This makes it more likely that those same-sex couples will incur higher fees and rates for their loans as well.
Loan Costs and Interest Rates
The two primary components that reflect the cost of a loan are the closing fees and the interest rate. The closing fees are the sum total of all fees and credits that are paid by the borrowers when they close on their loan. The interest rate is the percent they are charged for borrowing the money. These two costs are highly correlated. A borrower may choose to pay a higher origination fee to secure a lower interest rate. A variety of other factors can influence both of these, including the down payment, income, credit score, race, and gender of the applicant.
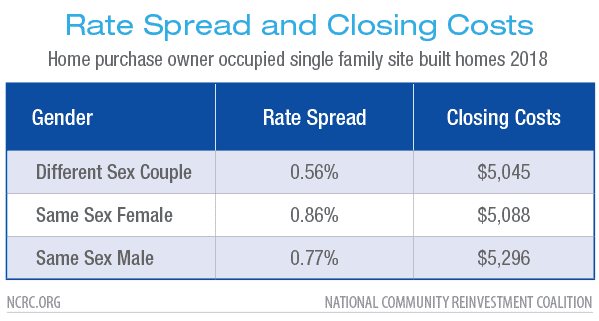
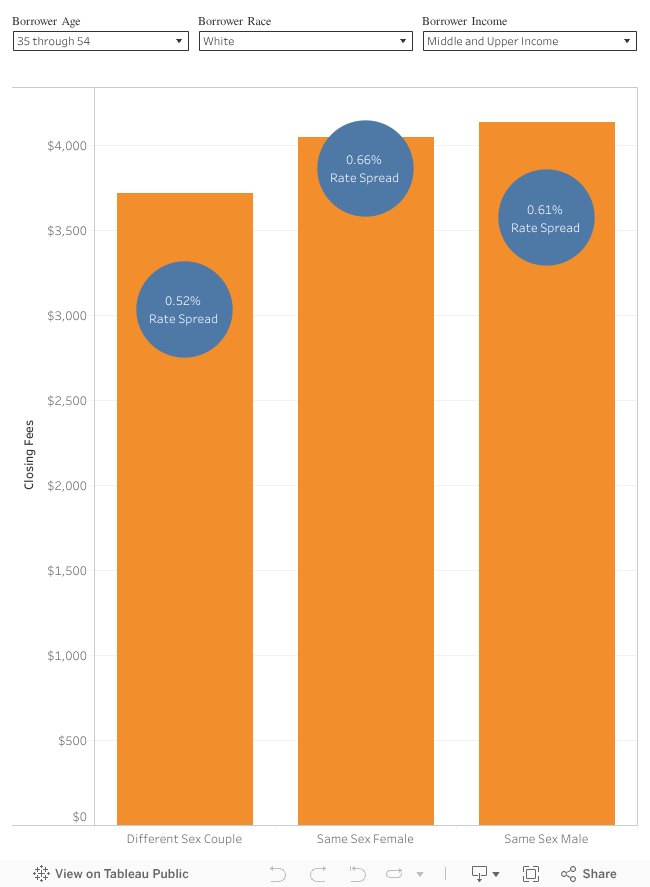
Higher closing fees can be due to a number of factors, including paying higher origination fees to lower the interest rate of the loan. Interest rates vary throughout the year based on a variety of factors. To normalize this data HMDA reports the ‘rate spread,’the percent that the rate at closing varies from an average rate for that day nationally. These rate spreads also suggest that same-sex couple paid higher interest rates despite the higher closing costs. This suggests that the closing costs were not due to borrowers buying down their rates, but were the result of other market forces. These forces could include lower down payment amounts, lower credit scores, or discrimination in the loan origination process based on race or other factors.
Borrower Age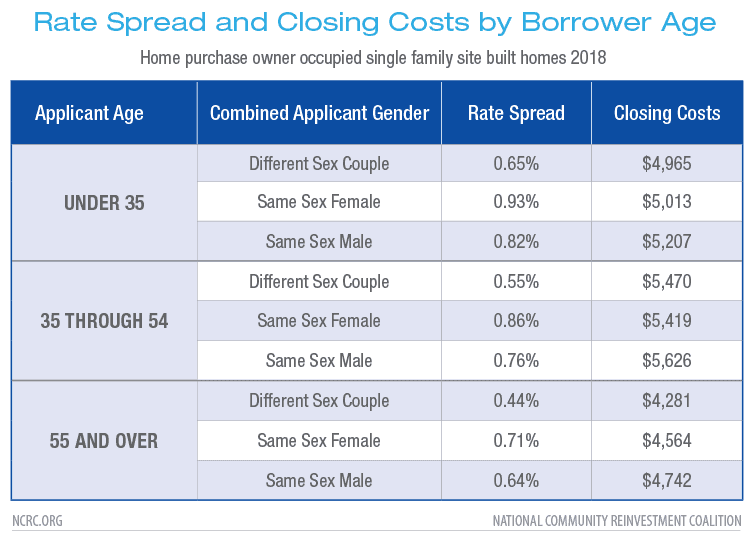
When we looked over loan costs by age of the applicant there was a clear difference between the rate offered same-sex couples compared with different-sex couples at all three age ranges. While at each age range there appeared to be a disparity, it was more pronounced at each age for same-sex female couples. For borrowers under the age of 35, different-sex couples paid .63% above average for their home purchases, compared with .93% for same-sex females and .82% for same-sex males. This means that same-sex female couples paid 43% more than different-sex couples. For ages 35 through 54, the difference was even larger, with same-sex female couples paying on average 57% more. Same-sex couples over the age of 55 saw the highest disparities. A same-sex female couple with a 55+ applicant could expect to pay a premium on their loan that was 61% more than a 55+ different-sex couple.
Closing fees do not explain the higher rates for same-sex applicants, since the closing fees charged do not differ appreciably from those charged to same-sex couples. This suggests that those higher rates were due to other factors, and that different-sex borrowers are not buying down their rates to a greater degree than same-sex couples.
Borrower Race
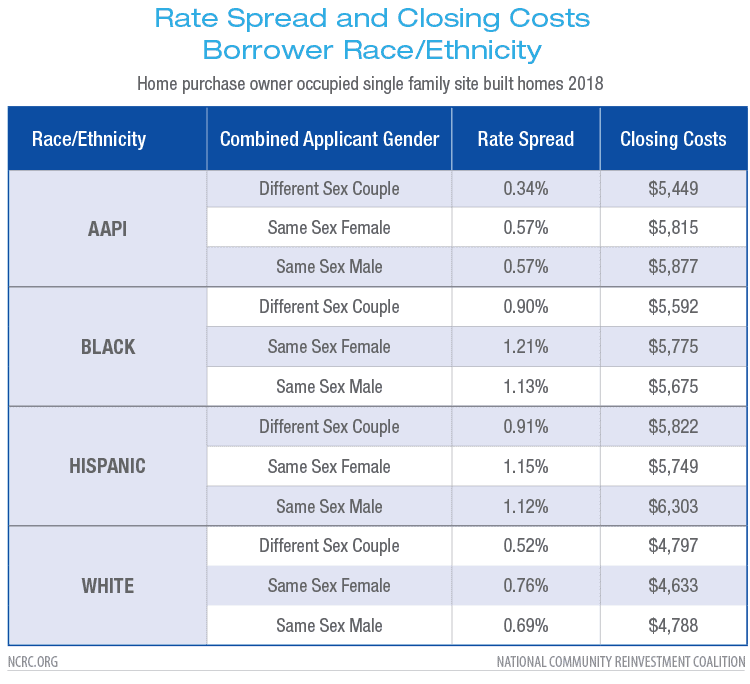
When we looked at cost for same-sex couples by race of the applicant we observed a similar pattern to that of borrower age. Same-sex couples paid a higher interest rate relative to different-sex couples in every racial group including White non-Hispanic, but Black same-sex applicants were particularly affected. Black male coupled buyers paid a rate spread premium of 1.13%, a 24% increase over that paid by different-sex couples. Black female couples paid 1.21% more, a 32% difference from different-sex couples. Again, we saw no substantial difference in closing fees between different and same-sex couples that would help explain this cost imbalance. For same-sex couples and different-sex couples alike, there was a considerable gap between the rates and costs facing White and AAPI (Asian American and Pacific Islander) borrowers, and the rates and costs facing Black and Hispanic borrowers. However, same-sex couples in all of those racial groups paid higher interest rates than their different-sex counterparts.
Borrower Income
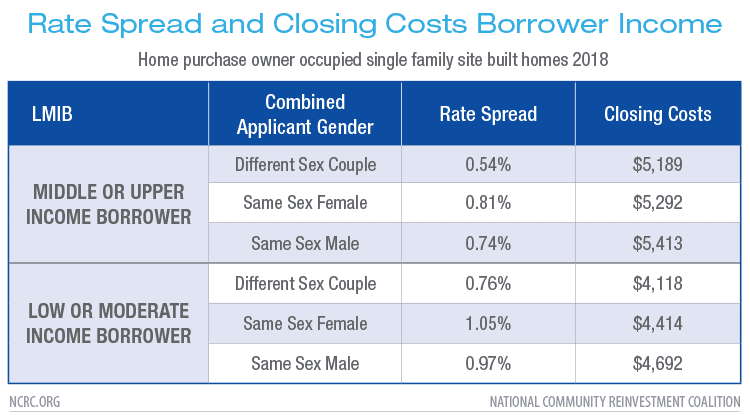
Borrower income has well understood implications for lending, with lower income borrowers often paying more in interest rates and less in overall closing fees due to the likelihood their loans will be smaller than loans obtained by higher income applicants.
When looking at this via a same-sex lens what is striking is the degree that even within those income defined groups there is a large degree of variation between the rates and fees charged to same-sex borrowers. Just as they do with race and age, same-sex female couples in particular seemed to pay more than male same-sex couples and different-sex couples.
There are some possible explanations for loan rates being higher for lower income borrowers. Smaller loans often incur higher interest rates to meet profit targets for the lender. Higher closing costs can be attributed to a borrower choosing to pay down their interest rates. But in the 2018 data we reviewed this did not appear to be the case. Same-sex LMI female couples paid 1.05% more for their home purchase loans compared with .76% paid by different-sex couples, a 29% difference. They also paid slightly more in closing fees, $4,414 compared with $4,118 for LMI different-sex couples. But average loan amounts for same-sex LMI female couples and different-sex LMI couples were both about $180k. For same-sex males couples the average loan amount was larger, at just over $200k. Yet they still pay a rate spread 29% higher than different-sex LMI couples.
Lender Type
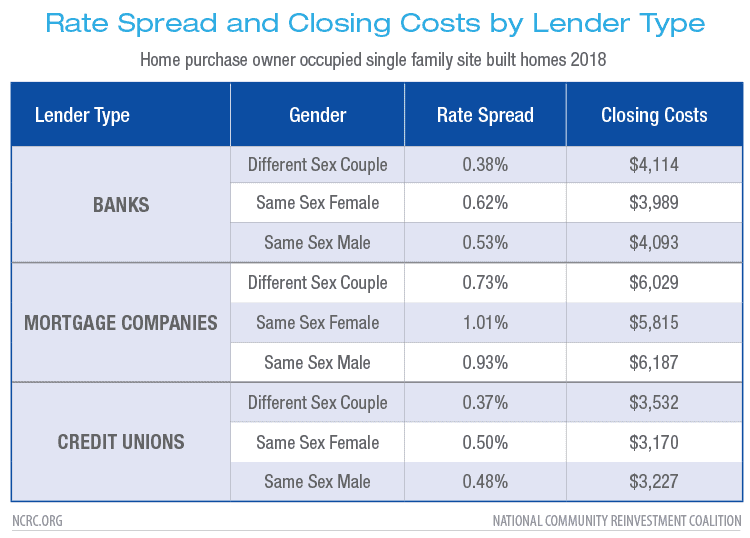
All couples using a bank or credit union to fund their home purchase loans reported a much lower rate spread than couples that borrowed from mortgage companies in 2018. Same-sex couples also paid a premium rate spread when compared to different-sex couples regardless of the lender type, with same-sex female borrowers using a mortgage company paying a rate spread 28% higher than different-sex mortgage company borrowers and 62% higher that different-sex borrowers that used a bank to fund their purchase.
Different-sex couples also paid lower closing costs, with mortgage companies charging different-sex borrowers $1,900 more than banks and $2,500 more than credit unions. Similar differences were observed in closing costs paid by same-sex couples as well. This suggests that closing costs are roughly similar for both same and different-sex couples that use the same type of lender. However, the greater likelihood that a same-sex borrower will use a mortgage company means that a great share of same-sex home buyers are paying those higher costs.
Origination and Denial Rates
Mortgage loan applications do not always result in a loan origination or a denial. The HMDA dataset uses a variety of possible outcomes to allow more detail. For this reason it is important to consider both the origination and the denial rates.
Borrower Age
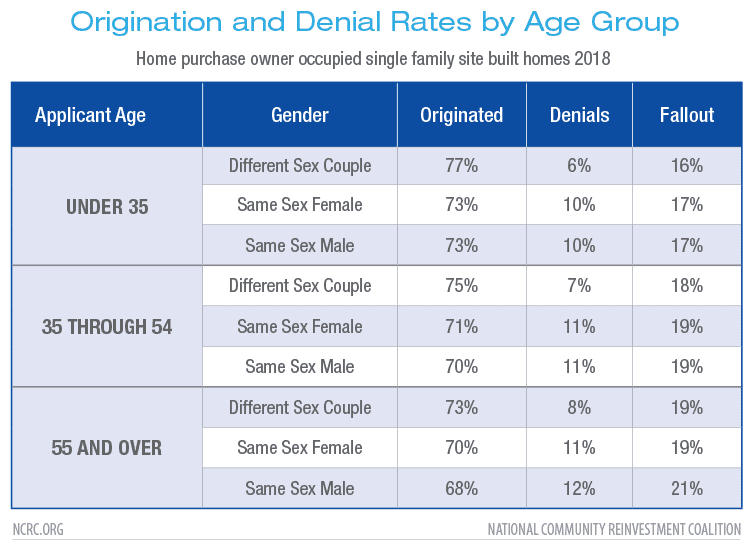
Among different applicant age groups we observed a variation in the origination rates for home purchase applications from same-sex couples to varying degrees. The origination rates varied by 3% to 5% below different-sex couples across the different age grouping. This variation also appeared in the denial rates, where same-sex couples regardless of gender showed a greater likelihood of being denied a home purchase loan than different-sex couples in the same age range.
Borrower Race
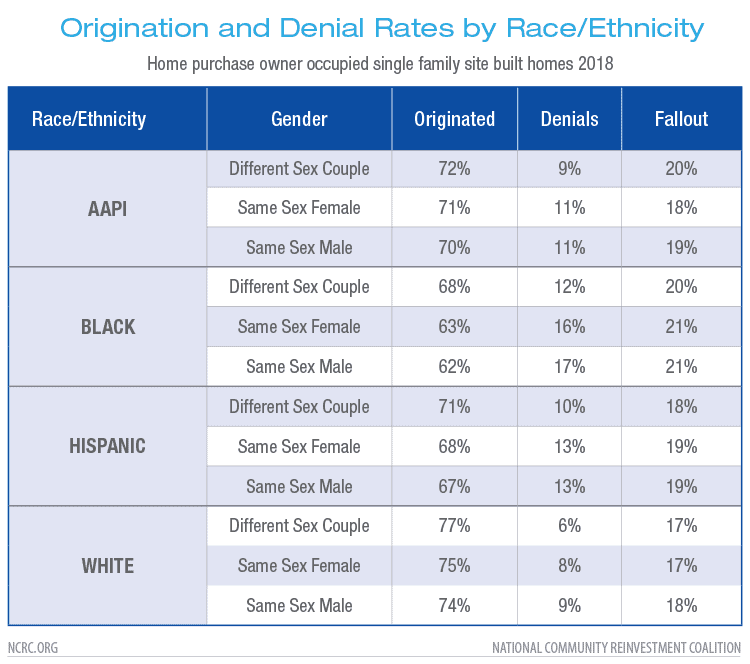
Between the largest four race and ethnics groups there are well studied variations in both the origination and denial rates. Here there appeared to be minor variations within racial groups as well, with same-sex White couples seeing their loan applications result in originations 2%-3% less than their different-sex White counterparts. This deviance from different-sex results was a bit larger among Black and Hispanic applicants, but shrank for Asian American and Pacific Islanders.
Borrower Income
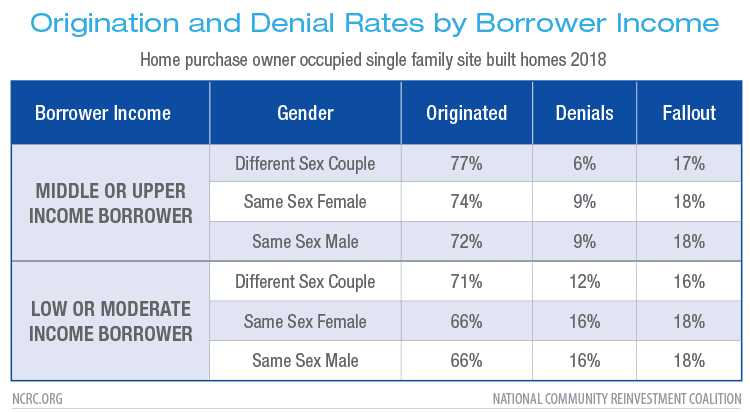
Low or moderate income borrowers consistently report lower origination rates and higher denial rates than higher income applicants. However, same-sex LMI applicants appeared to be at a severe disadvantage here compared to both LMI and MUI (middle and upper income) different-sex couples. Same-sex couples that were MUI outperformed both same and different-sex LMI couples by several percentage points as well. Just 66% of same-sex applications resulted in an originations compared with 72% to 74% of same-sex MUI couples.
Lender Type
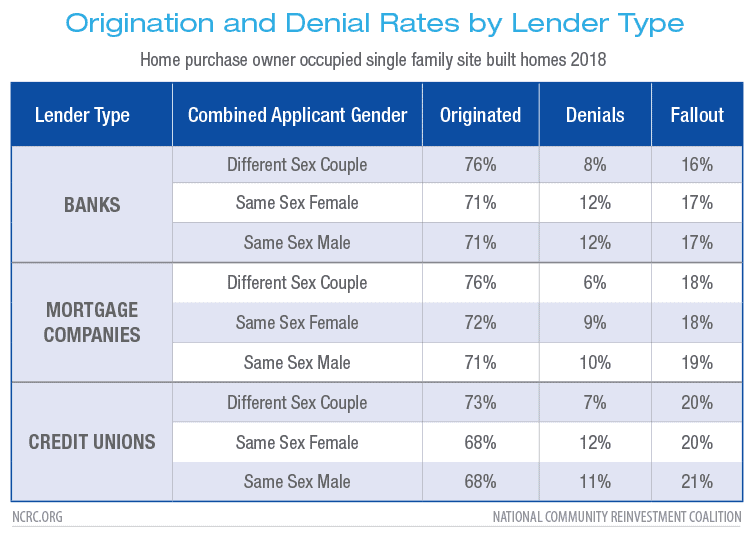
Origination rates for same-sex couples were lower at all lender types compared to different-sex borrowers and denial rates were much higher. In particular, Credit Unions, which tend to be the more financially advantageous lender option, reported the lowest origination rates for same-sex borrowers with just 68% of applications resulting in an origination.
Conclusions
Currently in the United States, there are 22 states with laws prohibiting sexual orientation and gender identity discrimination. The Fair Housing Act of 1968, the nation’s federal legislation on housing discrimination, does not include same-sex couples or LBGTQ+ community members as a special population requiring protection under the law. The recent Supreme Court ruling, Bostock v. Clayton County, Georgia, protects LGBTQ+ workers from discrimination based on their sexual orientation and/or gender identity. While the case was focused on employment decisions, it will likely have broad implications for the definition of sex discrimination in other types of cases, including fair lending and fair housing cases.
This descriptive analysis did not attempt to discern causality for variations or establish statistical significance to our findings. With additional research and study, we could provide categorical responses around the question of systemic discrimination against same-sex couples. Systemic housing discrimination against same-sex couples may indeed exist. With further study, we might be able to discern the strength of that possibility and call on policymakers to address the need for fair housing and fair lending laws to be inclusive of same-sex couples.
We also found very little literature addressing this topic other than anecdotal examples. Given the expansion of the HMDA dataset to include loan pricing and other data, the lack of research into this topic, and our findings, we feel that further research is warranted.
The HMDA dataset now offers researchers detailed information on loan pricing, costs, race, gender, income, location, and lender and can be utilized to better understand the structural and cultural barriers faced by same-sex couples in the mortgage ecosystem. We hope that this short report will spur additional attention from stakeholders to address lending disparities and discrimination against the same-sex community.
[1] According the FFIEC Census file that accompanies HMDA data these census tracts had less than 50% non-Hispanic White population.
