Executive summary
The National Community Reinvestment Coalition (NCRC) analyzed recent mortgage and small business lending activity in areas that were categorized and “redlined” by the Home Owner’s Loan Corporation (HOLC) during the 1930s. HOLC examiners were sent to over 200 cities 80 years ago to determine the risk associated with neighborhoods1. This information was used to assess the risk of underwriting refinance loans that had been made to keep families in their homes amidst the Great Depression. Following the HOLC period, the Federal Housing Administration (FHA) used HOLC-like mapping methods in their underwriting to maintain racial segregation practices until they were outlawed in the 1960s.
Previously, NCRC found that neighborhoods with the lowest HOLC grades are mostly minority-majority and low- to moderate-income (LMI) today.2Access to credit in neighborhoods classified as “hazardous” or “declining,” was restricted for years, but with changes to cities from processes like gentrification, how are the HOLC low-graded neighborhoods faring in access to credit now?
This report indicates that significant lending disparity in the HOLC low-graded neighborhoods persists today.
Areas that received low grades from HOLC examiners continue to be starved of home mortgage and business loans today. This lack of investment further concentrates minority families with lower incomes in these neighborhoods. Loans to low-income borrowers can be riskier for lenders, depending on individual credit history, offering the defense that the lack of lending there is consistent with safe and sound business practice. While gentrification increases lending to redlined areas, it still falls short of the investment in gentrified areas that were not redlined during the HOLC period.
Analysis of 38,049 urban census tracts across 138 cities was completed by dividing tracts into four categories:
- “Low-graded” tracts contained neighborhoods that the HOLC graded hazardous or declining.
- “High-graded” tracts contained neighborhoods that the HOLC graded as best or desirable.
- “Mixed” tracts contain a mixture of different HOLC grades, in both low and high categories.
- “NA,” or never-graded tracts were outside the HOLC graded areas. These areas were non-residential during the HOLC era and likely developed at a later date.
We then looked at small business and home mortgage lending in these tracts from 2012 through 2017. The Federal Financial Institutions Examination Council (FFIEC) Community Reinvestment Act (CRA) aggregate small business dataset was used to provide the quantity and amount of loans made in these areas. For home purchase lending, the Home Mortgage Disclosure Act (HMDA) single-family house lending data was used. The results showed highly significant differences in both small business and home purchase lending between the categories of tracts:
- 87% of 138 cities showed a significant reduction in mortgage lending to HOLC low-graded neighborhoods compared to the other areas.
- Mortgages to homes were significantly more plentiful in HOLC high-graded or never-graded tracts than in low-graded ones. There were 51% more home purchase loans in high-graded and 91% more in never-graded tracts than there were in low-graded ones.
- For small business lending, 68% of 138 cities showed a significant reduction in volume or amount of lending in the low-graded tracts.
- If recently gentrified areas are considered, there were 81% fewer small business loans in ungentrified low- graded tracts than in the ones that were gentrified. On average, there were 34% more loans in never-graded areas than inthe low-graded ones. High-graded and gentrified tracts had the lowest levels of small business lending because they are prime residential areas that were likely to be zoned as residential, and are also distant from commercial or industrial areas where small business lending is concentrated.
- In tracts where the HOLC assigned a low grade, the amount being loaned today is also less. The average loan in these areas was $13,558, 24% less than ungentrified neighborhoods that the HOLC had never mapped. Compared to areas that have gentrified, the amounts loaned were 95% less.
Introduction
Since they were rediscovered in the 1980’s, the redlining maps completed by the HOLC have gained much notoriety. These maps were formally known as residential security maps and were completed as a neighborhood-level assessment of mortgage lending risk during the period from 1935 to about 1939. They document how bankers, real estate professionals and local government officials viewed the credit-worthiness of neighborhoods in their city. The creation of the maps was a systematic process, where neighborhoods were evaluated on housing condition and value, neighborhood siting and amenities and the social, economic and racial/ethnic mix of the residents. Consequently, the maps reflect the segregated structure of American life, and neighborhoods with any black residents were given the lowest grade – hazardous, and then shaded red on the map by HOLC examiners. This hazardous grade meant that neighborhoods were high-risk, and excluded from access to capital for mortgages, or had much higher-cost loans. In our prior report, HOLC Redlining” Maps: The persistent structure of segregation and economic inequality, NCRC studied the correspondence of low-graded neighborhoods with current levels of income and the presence of minority residents. We found that 74% of the low-graded neighborhoods from 80 years ago are now LMI and 64% are majority-minority. However, it was unclear the degree to which current lending patterns in these neighborhoods corresponded with the HOLC classifications. Do these credit “starved” HOLC low-graded neighborhoods from the 1930’s have less small business and mortgage lending today?
Methodology
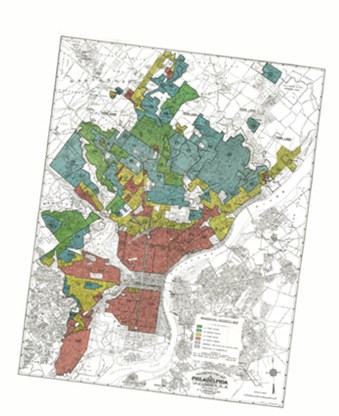
In order to answer this question, NCRC studied present levels of mortgage and business lending in areas classified by the HOLC residential security maps in the 1930’s, along with present areas of cities that had not yet been developed. A total of 115 of the original maps, which includes 138 cities, have been analyzed for correspondence between their old neighborhood classifications and current demographics and lending patterns. HOLC maps use a four-tier classification system for residential areas. The most desirable neighborhoods, or “Best,” were graded A and color-coded green. The next tier of “Still Desirable” neighborhoods were graded B and colored blue. Neighborhoods that were less desirable were labeled as “Definitely Declining,” graded C and colored yellow, and the lowest grade was D, where neighborhoods were labeled as “Hazardous” and colored red. The figure on the right shows how neighborhoods in Philadelphia were classified in a 1937 map.
HOLC Grades classified as "High" and "Low"
 1937
1937
 2010
2010
Use split slider to compare images
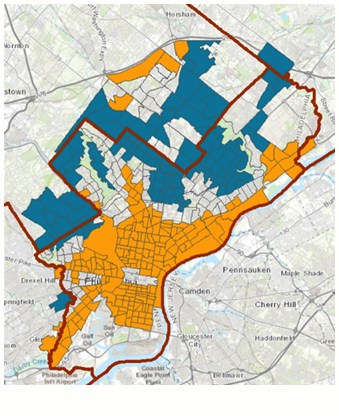
LEFT, Philadelphia 2010 – 2010 census tracts coded by HOLC grading into “low grade” = orange, and “high grade”=blue. “Low grade” tracts contained only HOLC “hazardous” and “declining” areas, while “high grade” contain HOLC “best” and “desirable” graded neighborhoods. Tracts with “mixed” grades comprising both “lower” and “upper” neighborhoods or that were not in the HOLC maps are not color-coded. (Source: U. of Richmond shapefile, with author’s calculations of HOLC designations)
RIGHT, Philadelphia 1937 -HOLC residential security map of Philadelphia in 1937 showing “hazardous” = red, “declining”=yellow, “desirable”=blue, and “best” = green neighborhoods. (Source: original HOLC map)
Census tract boundaries do not conform to the neighborhood boundaries used by HOLC examiners in the 1930s. A present-day tract could contain areas that had several different HOLC grades. To adjust for this, we categorized tracts as “Low-graded,” “High-graded,” “Mixed” and never-graded or “NA.” Low-graded tracts contain areas categorized by the HOLC as C, D or C and D. High-graded tracts contain the highest tier grades A, B and A and B. Finally, the tracts classified as Mixed contained a combination of both the highest and lowest graded areas. The never-graded areas were non-residential when the HOLC maps were drawn and could represent industrial areas or empty land that was developed later. Table 1 shows the different categories and the number of tracts classified at the national level.

After classifying the census tracts, we gathered data on the number of mortgage loans from 2012-2017 and the number and total dollar amount of small business loans made between 2012 and 2016. A complete dataset of mortgages made in the U.S. is available under HMDA, while small business lending data reported by banks is available under CRA. The mortgage data and the small business lending data were superimposed on maps of the consolidated HOLC classified areas using a geographic information system (GIS). We then analyzed the results using statistical methods to determine whether there were correspondences between current lending patterns and the old HOLC designations. Using Philadelphia small business lending as an example, we can see large volumes of lending in many suburban neighborhoods that were high-graded, but also a pattern of concentrated lending in HOLC low-graded neighborhoods around the downtown. Why is there a pattern of concentrated business lending in the downtown area? The downtown centers of many cities are undergoing intensive gentrification. If we examine the pattern of gentrification in Philadelphia since 2000, we find that there is extensive gentrification in, or adjacent to, the downtown tracts that had high levels of lending. To mitigate the effects of recent gentrification, we conducted our analysis using a full dataset with all tracts, and then another from which the gentrified areas were removed.
Small Business Lending and Gentrifying Areas
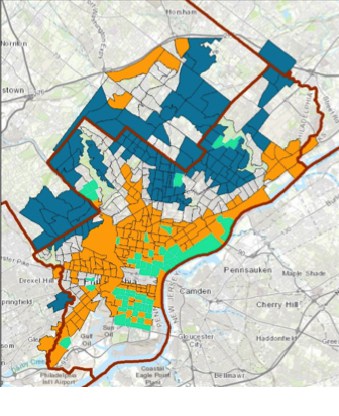 Figure 2b
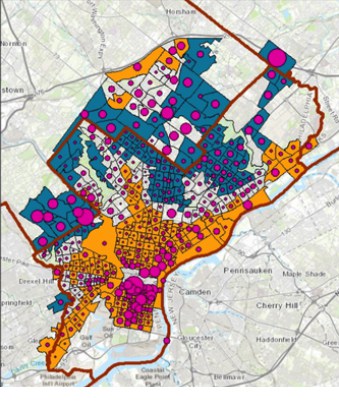 Figure 2a
Use split slider to compare images
Figure 2a “Low” and “High”classified census tracts with the number of business loans by tract in the period 2012-2016. Tracts with “mixed” classification comprising both “lower” and “upper” neighborhoods, and tracts not classified by the HOLC (NA) are not color-coded. (Source: FFIEC CRA reported small business data)
Figure 2b Philadelphia census tracts with indications of gentrification including the highest increases in median home value, college educated residents, and increases in median household income 2000-2013. (Source: US Census 2000 and ACS 2009-2013)
Results
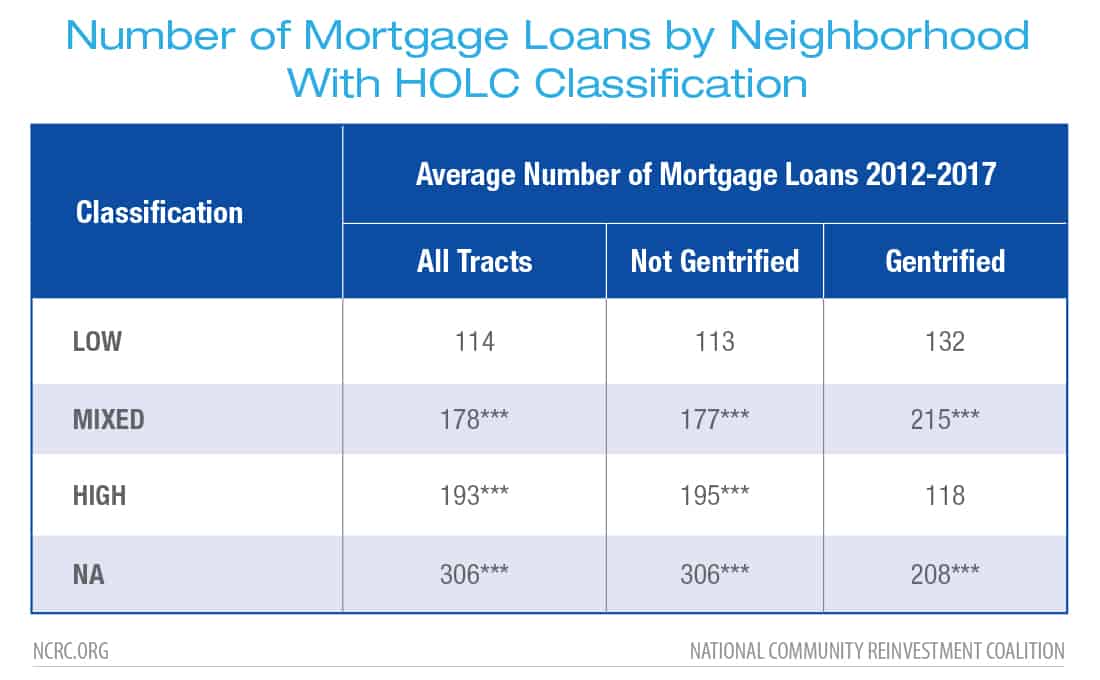
At the national level, of the 138 cities available for this analysis, 87% showed a statistically significant reduction in mortgage lending between the HOLC low-graded census tracts and the high and mixed-graded, or NA areas, of their city. On average, from 2012 to 2017, there were only 113 loans in low-graded tracts that had not gentrified, compared to 306 loans in tracts that were never-graded by the HOLC (Table 2). Most of the never-graded tracts are in areas of cities that were developed after the HOLC residential security maps classification program completed in the late 1930s. These NA areas encompass not only neighborhoods developed during the period of suburbanization from the late 1940s through the 1990s, but still developing and possibly expanding neighborhoods. On average, there were 171% more (306 versus 114) mortgage loans in the NA areas than in the low-graded ones. The second greatest difference was between the low-graded and high-graded tracts, where there were 73% more mortgage loans.
For small business lending, 68% of cities showed similar reductions in lending in the low-graded tracts from areas that were never-graded or had mixed grades between the period from 2012-2016. Low-graded tracts that did not gentrify had low numbers of loans, while the ungraded and gentrified tracts had the highest numbers of loans. During a five-year span, only 321 business loans were made in low-graded areas that did not gentrify, compared to 758 business loans in ungraded and gentrified areas, 138% difference (Table 3). There were significant differences in the number of business loans in low-graded tracts and tracts with other classifications, except in the case of high and mixed-graded areas that gentrified. There were only 202 loans in the high-graded and gentrified tracts. A possible explanation is that the HOLC high-graded tracts were residential areas where homes had the highest structural quality and with the greatest access to amenities. These are desirable neighborhoods, away from the nuisances of industry and commercial traffic. Consequently, the zoning of these areas could prohibit commercial or industrial activities, preserving the purely residential character of the neighborhoods. Nationally, there were very few tracts that met the gentrified and high-grade criteria, only 27, which also increased the impact of outliers — tracts with exceptionally lower than average numbers of loans.
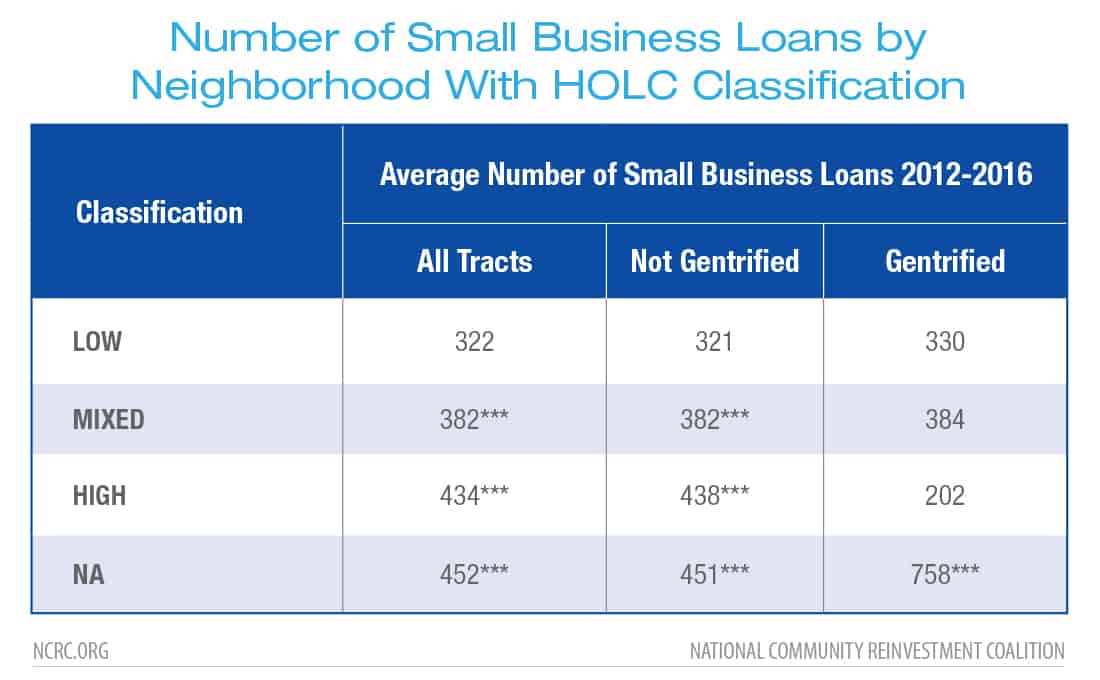
Next, we looked at the average dollar amount of loans by HOLC grade and the presence of gentrification, which revealed a pattern similar to that of the number of loans. The average business loan amount in the HOLC low-graded and not gentrified tracts was $13,518, compared to $38,204 in ungraded and gentrified tracts (Table 4). Additionally, the same pattern of the high-graded and gentrified tracts having the lowest business lending amount held up. The average loan was only $4,555 in these tracts. Instead of being excluded from access to capital in these residential neighborhoods, they were so exclusive, that business operations were less likely to occur there.

Conclusion
This report indicates there is still significant lending disparity in the HOLC low-graded neighborhoods. The low-graded areas are persisting neighborhoods of disinvestment. This indicates that redlining and factors like lower incomes and higher proportions of minority populations have impacted lending, starving these areas of the capital flow needed to buy and improve homes or for businesses to expand and prosper. In cases where gentrification was a factor, it has a substantial, measurable impact on neighborhood lending. Yet even low-graded and gentrified neighborhoods have fewer loans than gentrified areas in other categories, except for the number of loans in high-graded gentrified neighborhoods which are likely residential. These findings indicate that redlining reinforced the circumstances of economic and racial segregation and structural disinvestment in American cities.
