
Key Takeaways
- Independent mortgage companies expanded their dominance over banks for mortgage originations, and also dramatically increased their share of refinance lending since 2019.
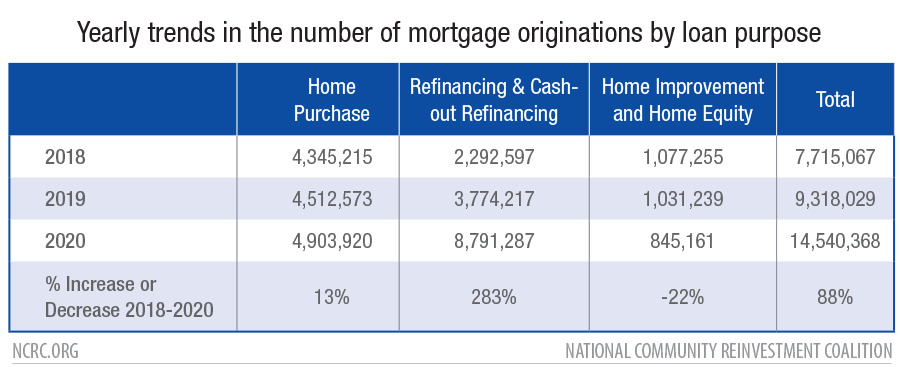
- Home buying volume remained steady during the pandemic, and refinance lending boomed in 2020.
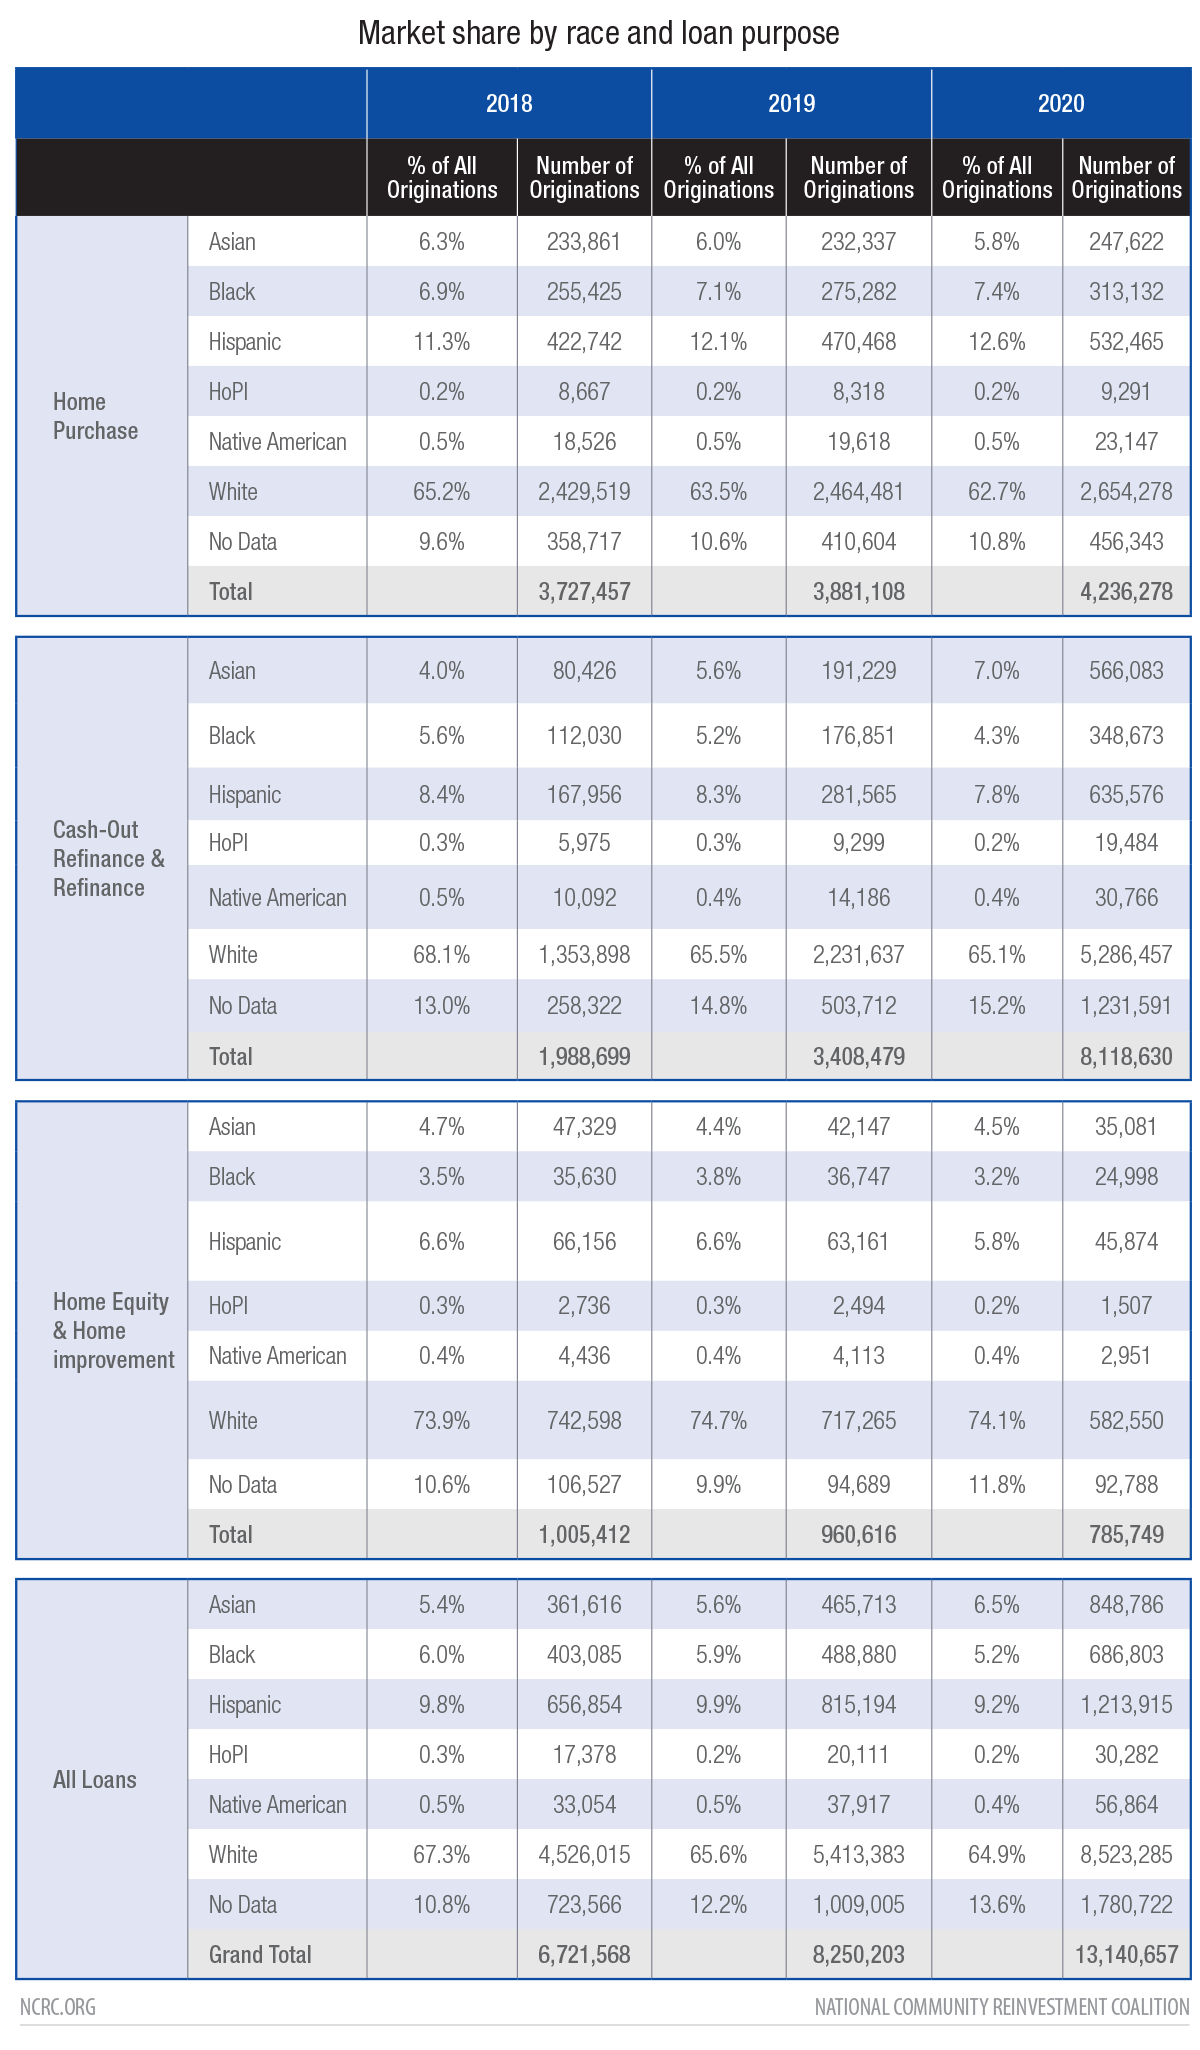
- White and Asian homeowners increased their share of refinance lending, while the share declined for Black and Hispanic homeowners. The impact of this is likely an increase in the share of the racial wealth gap driven by home equity.
- Black and Hispanic home buyers saw modest increases in their market share of home purchase loans, but were still far short of their population share or the increased lending needed to approach parity with the White homeownership rate.
- A growing number of larger lenders did not report demographic data. This is a threat to the usefulness of this critical national dataset.
Key Findings
- Refinance lending has increased substantially, from just 2.3 million loans in 2018 to 8.8 million in 2020.
- Asian homeowners dramatically increased their share of all refinance loans, jumping from 4% of all refinances in 2018 to 7% in 2020. Meanwhile, Black and Hispanic borrowers lost market share, with Black homeowners falling from 5.6% of all refinances in 2018 to just 4.3% in 2020 while Hispanics fell from 8.4% to 7.8%.
- 62% of originations in 2020 were made by independent mortgage companies, an increase from 55% in 2018.
- Average interest rates fell from 4.96% in 2018 to 3.31% in 2020.
- Black and Hispanic borrowers lost market share as a percent of all loans, falling from 5.9% to 5.2% and 9.9% to 9.2% respectively from 2019- 2020. These losses vary based on the purpose of the loan.
- Loans lacking demographic information continued to increase. From 2018 to 2020, that figure rose from 10.8% to 13.6% of all originations. When purchased loans are included, 22% of all loans reported in HMDA lacked demographic data.
Overview
In 2020, the HMDA data included over 25 million Loan Application Records (LAR). These applications resulted in 14.5 million loan originations, 5.2 million more loan originations than were reported in 2019. Just over 5 million of those loan originations were refinance loans, as the historically low interest rates afforded existing homeowners with an unprecedented opportunity to reduce their payments and build more wealth in their home equity. Meanwhile, home equity lending, where lenders offer smaller mortgages against the equity in the home for home improvements or other purposes, continued to decline in number.
The 2020 data also revealed the continued growth of loans in the HMDA dataset that do not include race or ethnicity information. The Home Mortgage Disclosure Act (Regulation C) requires that lenders collect demographic data except in cases where the application originates online, where the borrower is allowed to not answer these questions. Since 2018, the number of loan originations in HMDA that lack this critical information has grown from 10.8% to 13.6% of all originations. The absence of data is more acute for refinance loans, where 15.2% of loans made to owner occupied homes lack demographic data on race and ethnicity. This gap in HMDA likely masks a substantial imbalance in the race and ethnicity of borrowers that initiate their loans online. This is an area in which more research is needed.
Home Purchase Lending in 2020
In 2020, both Black and Hispanic borrowers continued to increase their market share of home purchase lending. These gains, however, were modest. Black borrowers saw their share of all home purchase loans increase from 7.1% of mortgages in 2019 to 7.4% in 2020. Hispanic borrowers grew from 11.9% to 12.4% over the same period. This increase in lending to Black and Hispanic borrowers as a share of all loans continued a trend that began in 2013. Black borrowers had fallen from 8.7% of home purchase loans in 2006 to just 4.8% by 2013. Hispanic borrowers had been 11.7% of the market in 2006 and were just 7.3% in 2013.
This growth in home purchasing is a critical step forward to ensuring homeownership is a viable option to build wealth for Black and Hispanic families. More specifically for Black Americans where a substantial increase in mortgage lending is needed to reach majority homeownership over the next decade.
Refinance Lending Exploded in 2020
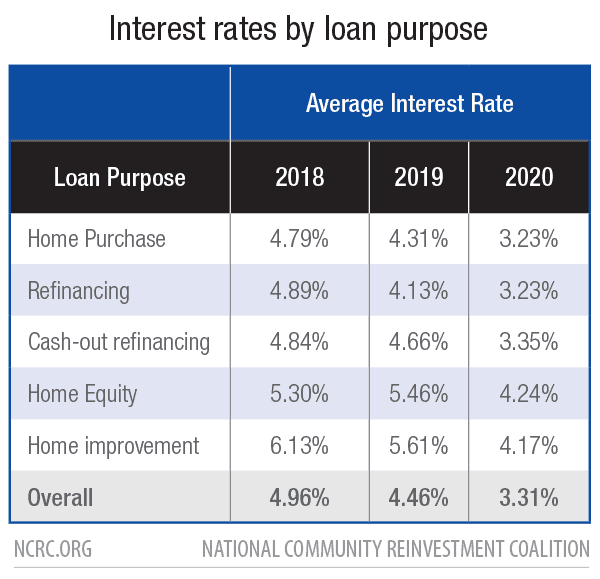
In 2020, the number of refinance and cash-out refinance loans made on owner-occupied, 1-4 unit, site built homes lept from 3.4 million in 2019 to 8.1 million in 2020. This increase in refinance lending was driven by record low interest rates. On average, the interest rate for refinance fell from 4.89% to 3.23% between 2018 and 2020, while cash-out refinance loans dropped from 4.84% to 3.35% over the same period.
For the third year in a row, refinance lending to Black homeowners declined as a share of all lending, dropping from 5.2% of all refinances in 2019 to just 4.3% in 2020. Hispanic refinance market share also fell, dropping from 8.3% to 7.8%.
Low-wealth financial portfolios and/or the economic vulnerability Blacks and Hispanics were more likely to have experienced in 2020 were major deterrents to refinancing. Low credit scores and/or high loan-to-value ratios — an output, in large part, of historic and structural economic inequality — can increase the risk of and disincentivize a borrower’s chance to refinance. Steep upfront costs are impossible to bear if a household is limited in cash and savings. As a result, Black and Hispanic homeowners miss out on significant mortgage interest savings throughout the life of the loan. Homes in neighborhoods that are majority Black or Hispanic are often appraised for less than similar homes in White neighborhoods. This can be due to the bias of individual appraisers or as a result of longstanding patterns of segregation and racially-biased lending policies. In either case, refinancing can be constrained due to a lack of equity in the home or other factors.
Non-Bank Mortgage Lenders Increase Market Share
In 2020, independent mortgage companies (IMCs) continued to claim additional market share at the expense of banks. IMCs accounted for 58% of the 13.1 million originations on owner occupied, 1-4 unit site built homes. For home purchase originations, 62% were issued by IMCs.
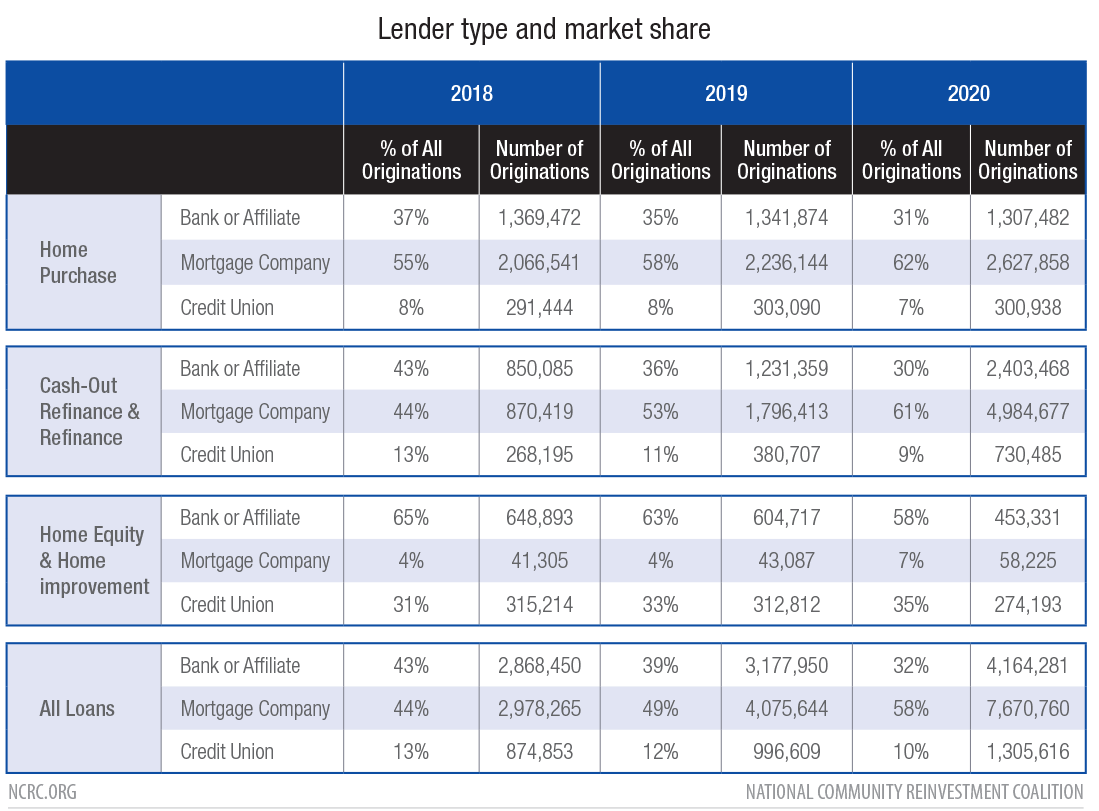
While all lenders increased the number of refinances they originated, mortgage companies expanded the most. In 2020, IMCs made nearly 5 million refinance loans, up from 1.8 million in 2019. This was a 277% increase, and easily outpaced the growth in refinance lending seen from banks and credit unions.
Communities and borrowers of color have often been underserved by traditional banks yet IMC’s filled the gap where traditional banks fell short in strengthening access to mortgage credit for borrowers with lesser financial status. However, given that IMC’s aren’t beholden to strict federal regulation – and that IMC growth in refinance lending didn’t equate to an increase in the share of refinance loans to Black and Latino borrowers – the true potential of IMC’s to increase the housing opportunity for people of color remains unclear.
Black and Latino Borrowers Continue to be Less Likely to get Approved for Home Purchase Lending
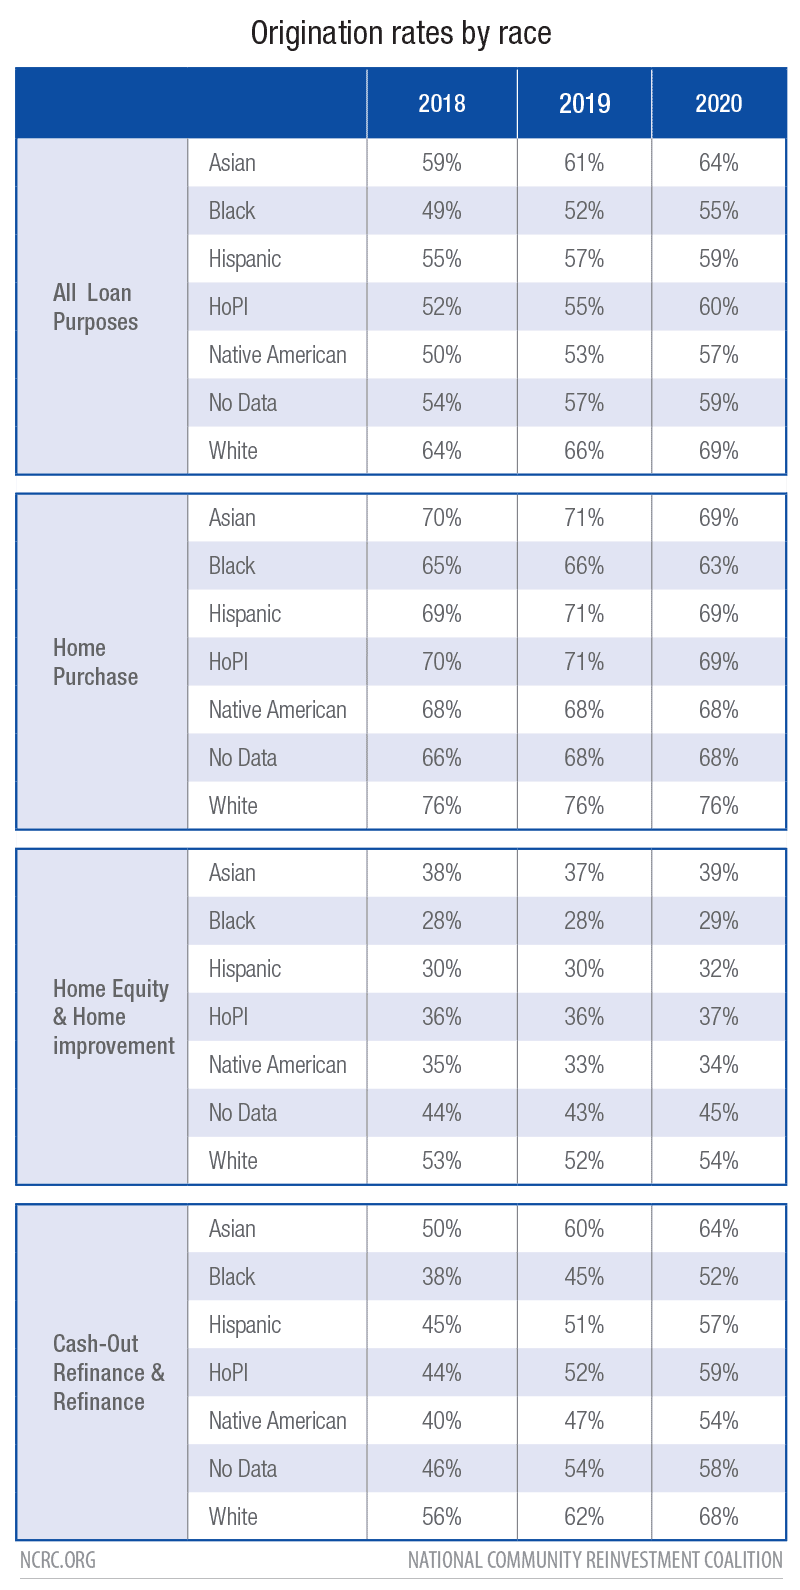
Origination rates are the measure of how many loan applications become originations, and are commonly used to look at how disparately different groups are treated by the mortgage market. In 2020, overall Black applicants saw their origination rates grow, from 52% of loan applications in 2019 to 55%. However, this varied a great deal based on the purpose of the loan. For home purchase lending origination, rates declined slightly among most minority groups, and remained even compared with 2019 only for White and Native. Although minority borrowers lost market share in the refinance and home equity markets, they also saw substantial increases in the origination rates for those loans. While minority market share was lower in 2020, more of the applications with a minority borrower became originations than in the previous two years.
Owner occupied, 1-4 unit, site built, forward loans. Action Take 1-5 is an application, action take 1 is an origination and action taken 3 is a denial.
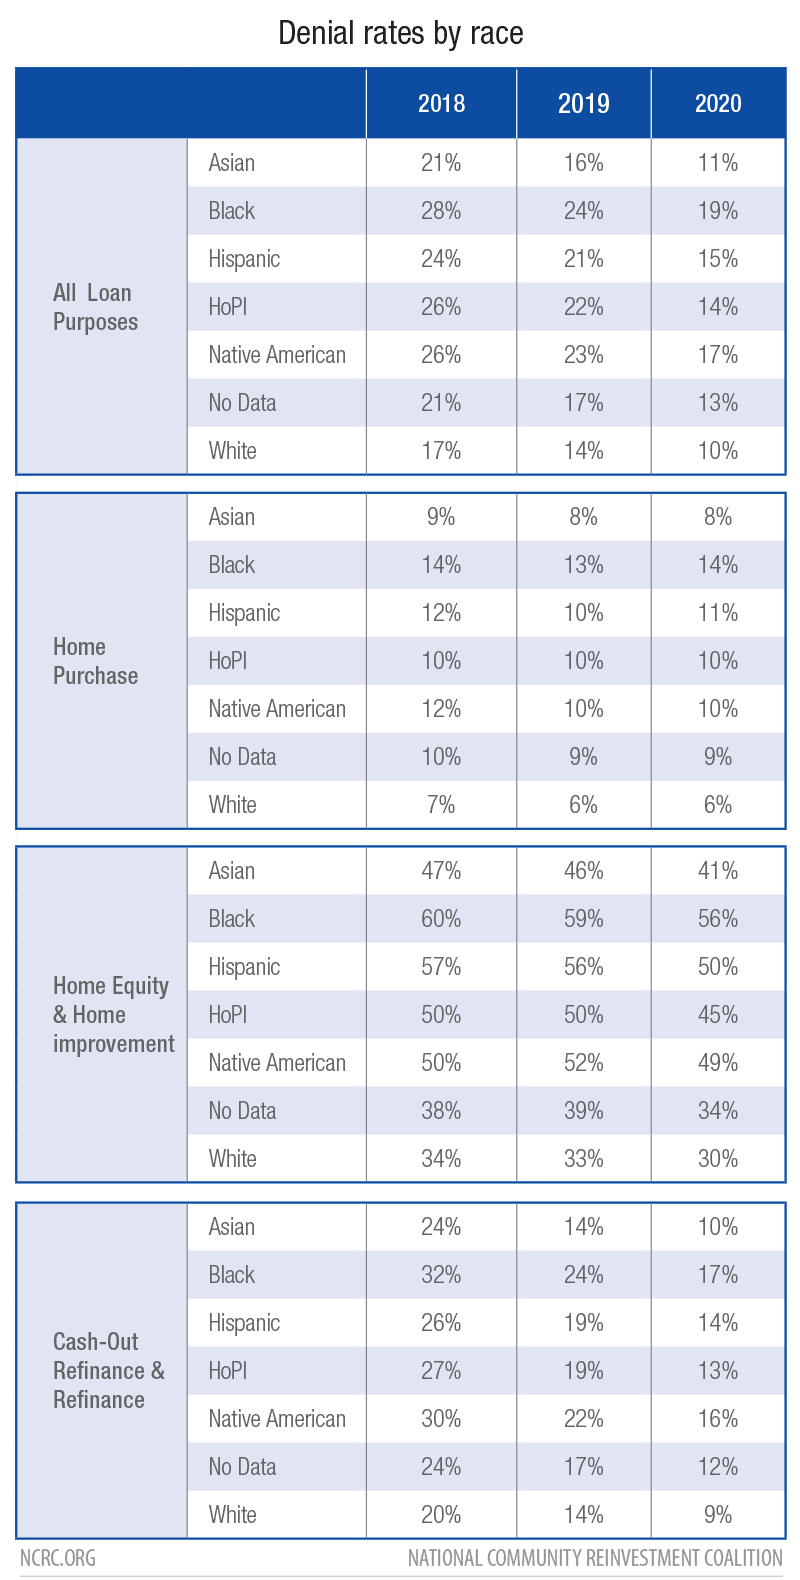
Denial rates in 2020 reflected a similar trend, with denial rates dropping across all borrower groups for refinance and home equity lending, while remaining flat for home purchase loans. Loan applications can result in one of three outcomes. An origination, where the loan closes and the refinance or home purchase occurs, a denial, where the lender refuses to fund the loan, or one of several other results that collectively are referred to as “fallout.” These include cases where the borrower fails to finish the application or declines to accept the loan terms offered by the lender. Some researchers do not consider all of these outcomes in the calculation of origination and denial rates, but NCRC feels that a more accurate measure takes into account every possible outcome from an application.
Denial reasons also vary greatly across different races. In particular, denials for credit history differ to an extraordinary degree. Just 10% of Asian denials were due to poor or no credit. Meanwhile, 30% of Black applicants were denied a loan due to issues with their credit score.
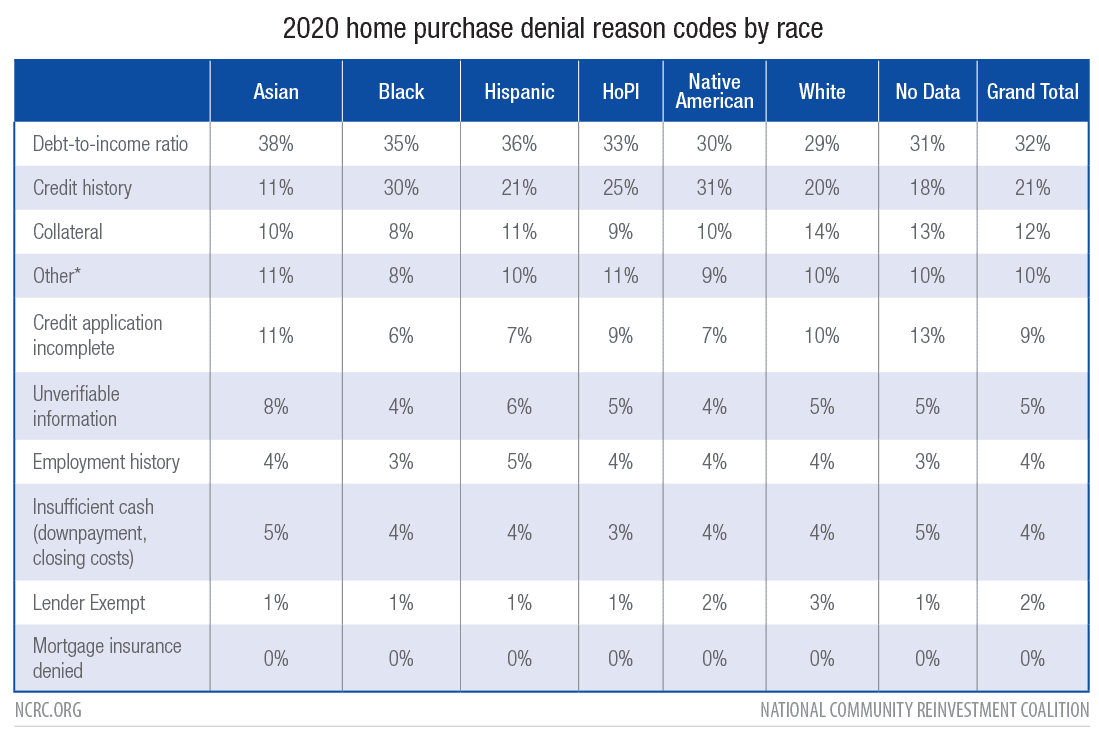
Racism and discrimination in the financial industry, as well as persistent economic inequality, contribute to Black and Latino borrowers being more likely than White borrowers to be denied for a loan. These precarious conditions often lead to high debt-to-income ratios and/or poor credit history. Such a plight underscores the need to have fairer laws, systems and products that accomodate low-wealth homebuyers and generate more favorable loan approval outcomes. Additionally, referring those who are denied a loan to housing counseling agencies that can provide critical education and resource intervention can help support homebuyers in strengthening their credit portfolio.
Lending to Low- and Moderate-Income borrowers and in Low- and Moderate-Income Communities
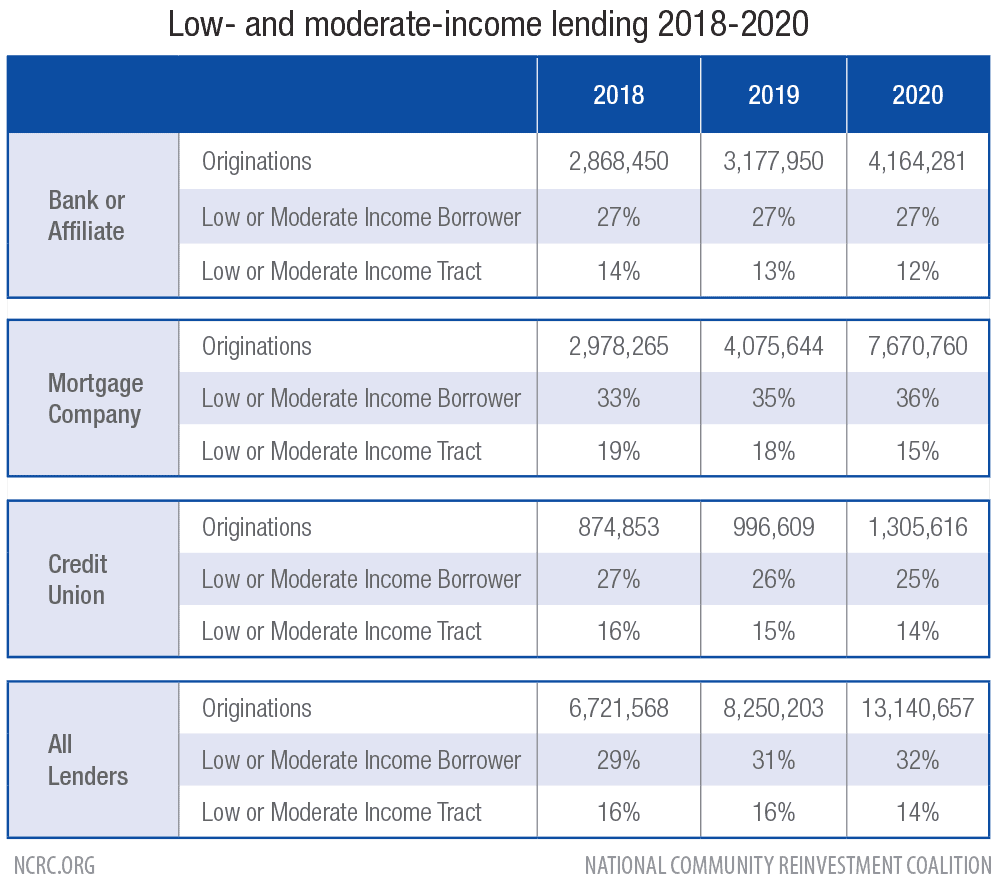
Lending to low- and moderate-income borrowers (LMI), where the applicant income is 80% or less of the median family income for the metropolitan area in which the loan originated, grew slightly to 32% of the 13.1 million originations in 2020. The number of loans to LMI census tracts, where the median family income of the tract is 80% or less than the area median income of the metropolitan area, fell slightly to just 14% of all mortgages in 2020.
Mortgage companies continued to increase the share of their lending to LMI borrowers, growing from 33% of their lending in 2018 to 36% in 2020. This comfortably exceeded the 32% of credit union loans and 27% of bank loans going to LMI borrowers.
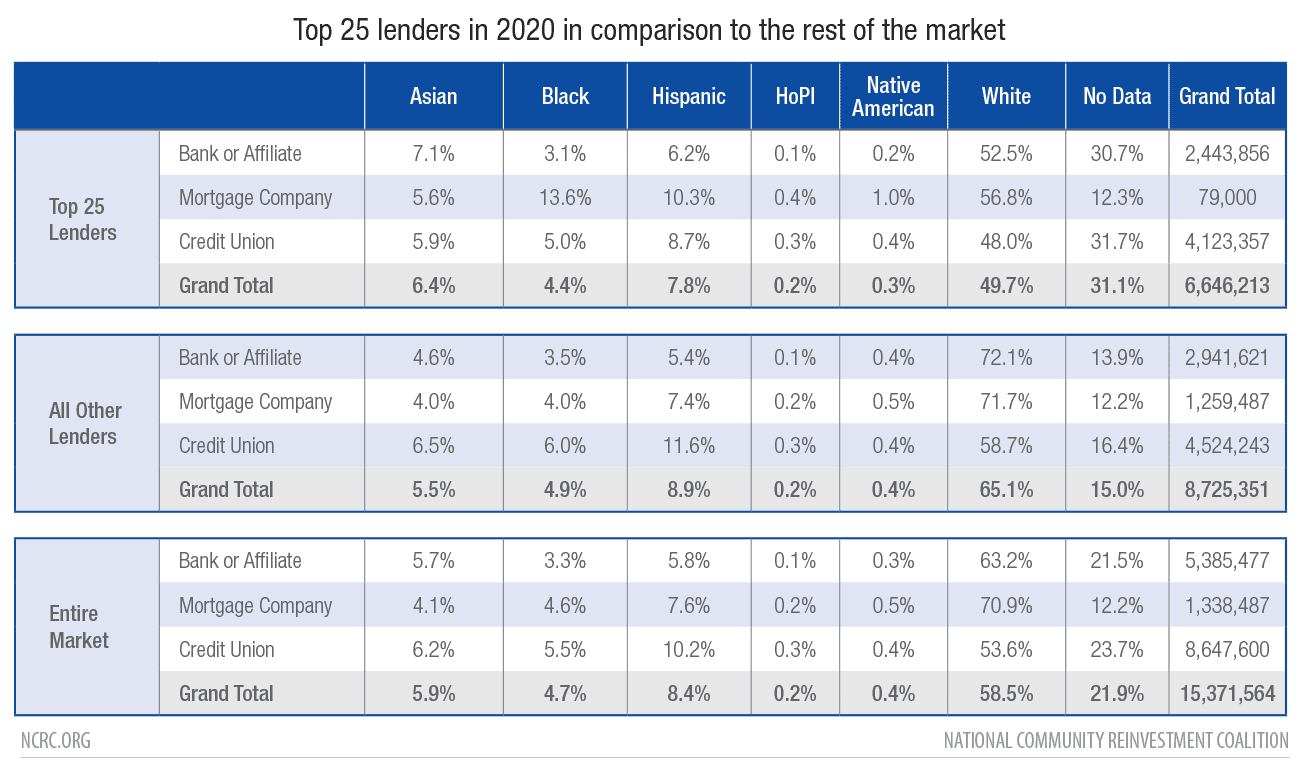
Top 25 Mortgage Lenders
The top 25 lenders continued to dominate the mortgage market, making or purchasing over 44% of all loans in 2020. They also made or purchased 44% of all loans to minority borrowers.
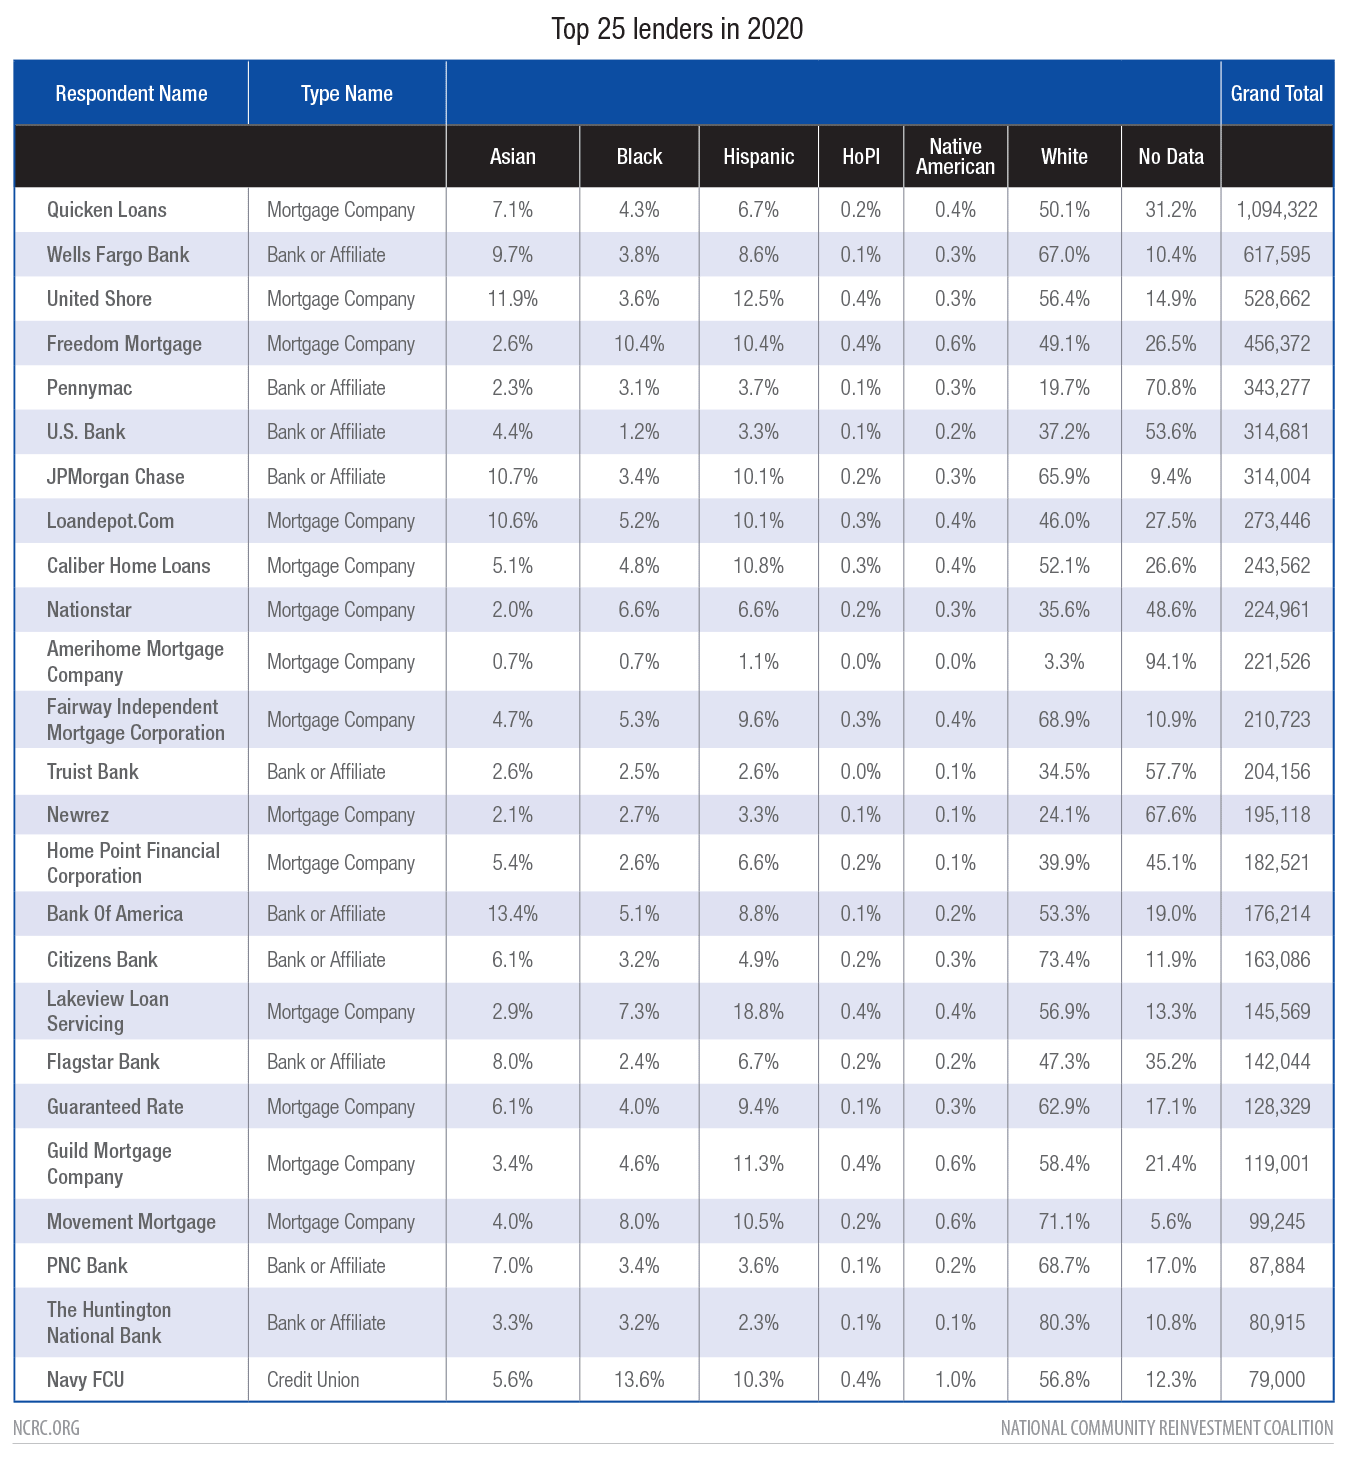
Among the top 25 lenders, originations made to minority applicants vary greatly, from a low of just 8.6% to a high of 32% of all loans.
The top 25 lenders are also a reminder of the scale at which Independent Mortgage Companies dominate the 2020 market.
Fueled by the recovery from the 2008-2009 housing crash, Wells Fargo reported just over 1.1 million originations in 2012. Quicken reported over 1 million originations for 2020, a first since at least 2007 for an IMC. In a sign of how completely IMCs now dominate the mortgage market, only eight banks made the top 25 list. The four largest IMCs made 2.35 million loans, comfortably exceeding the 2.27 million made by all eight Banks, combined.
Many of the top 25 lenders chose to remove demographic data from loans that they purchased from other lenders. In many cases, this meant that a majority of loans made possible by a lender were lacking such data.
Borrowers of Color Less Likely to Access Conventional Financing for Home Purchases, and More Likely to Turn to FHA Loans
The share of government insured loans fell to a three year low of 21.2%, driven by a substantial drop in the share of loans made using FHA insurance. Those loans, which totalled 1,107,554 in 2019, were 13.4% of the market. But in 2020, although the number of FHA loans grew to 1,286,062 loans, they were just 9.8% of all loans. This drop in FHA’s share of the mortgage market was largely driven by the explosive growth in conventional refinance lending as homeowners took advantage of interest rates that fell to record lows in 2020.
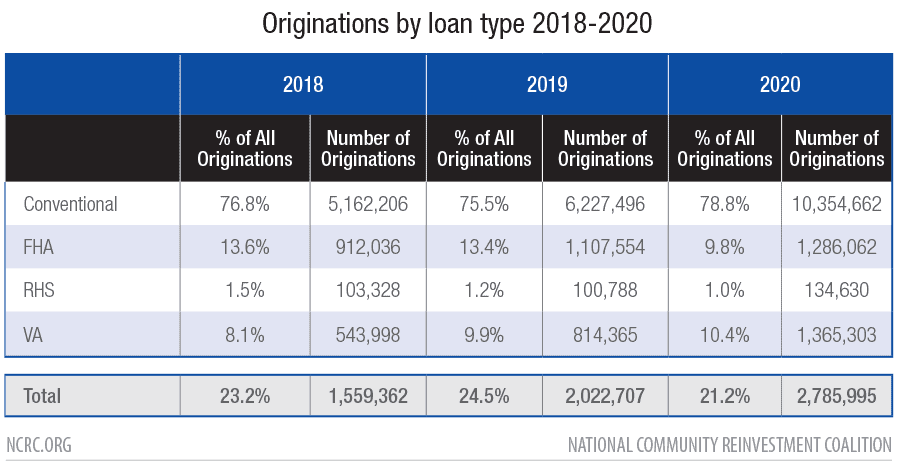
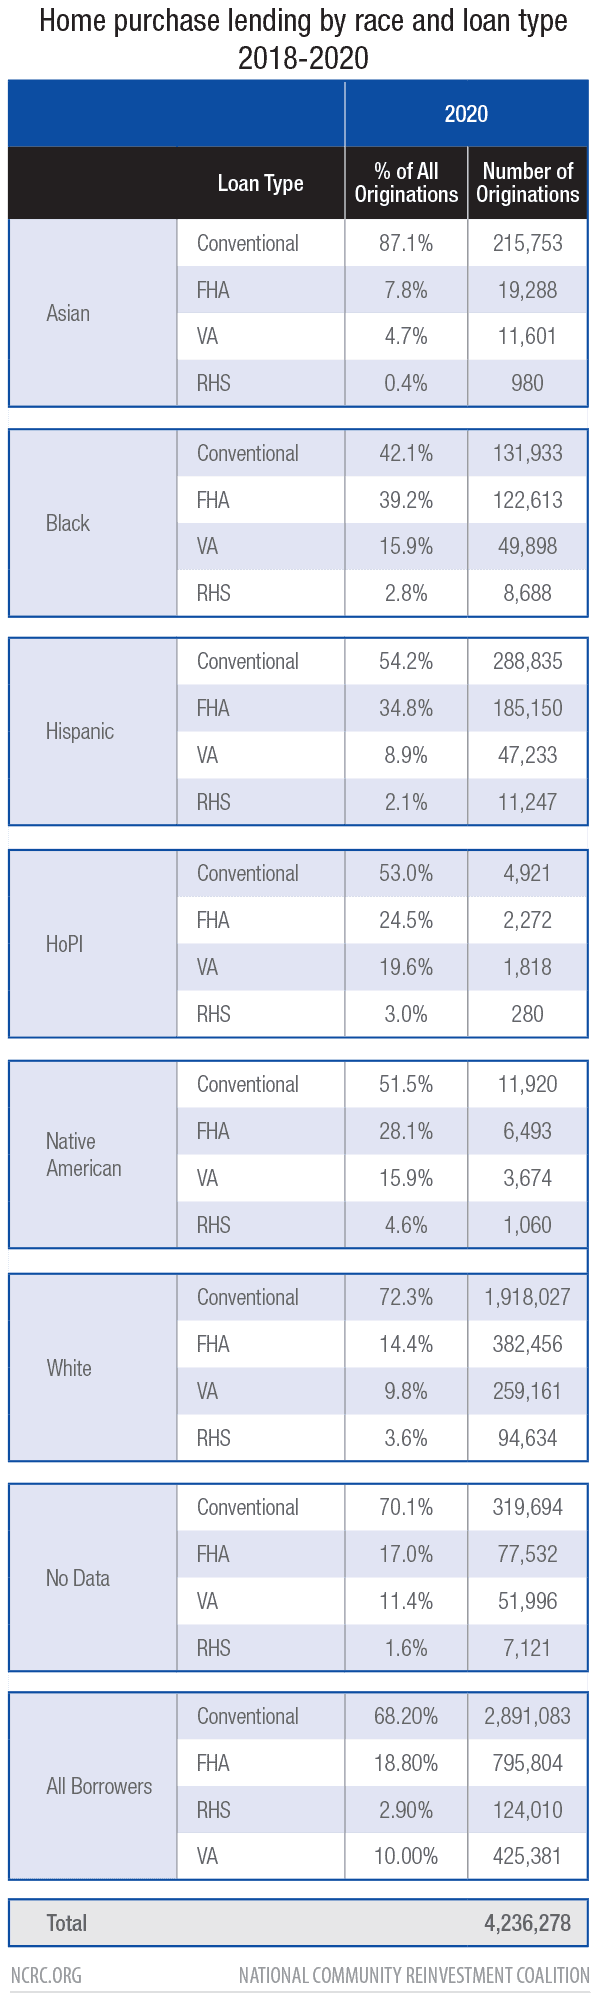
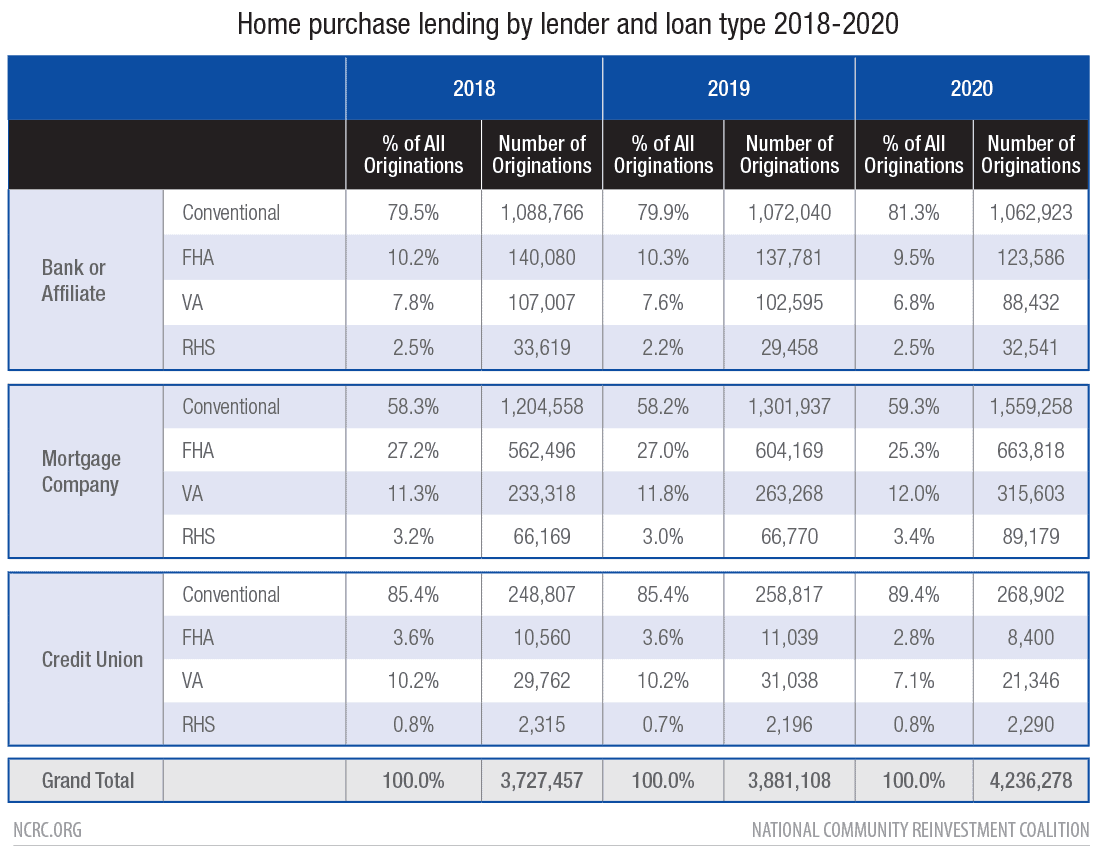
In terms of home purchase lending, government-insured lending programs including FHA, VA and RHS were still critically important for homebuyers. In 2020, 31.8% of the market used one of these programs, the same market share they held in 2018. The use of one or the other of these non-conventional loans was unevenly distributed across race and ethnicity.
While White non-Hispanic and Asian borrowers used conventional lending for 70% and 87% of their home purchases respectively, this was not the case for other groups. Black borrowers in particular were reliant on FHA (39.2%) and VA (15.9%) programs. Government insured programs are a critical tool for first-time buyers, LMI applicants and marginalized communities. However, banks were increasingly unlikely to use government insured lending programs. Since 2018, banks shrunk their use of FHA lending from 10.2% of all home purchase loans to 9.5%, and VA lending from 7.8% to 6.8%. Most of the largest bank lenders in the country did no FHA or VA lending at all.
Ideas for Future Research
This high level analysis of the 2020 HMDA dataset is a useful guide to the overall direction of the mortgage market and trends seen across racial groups that contribute to the racial wealth gap. Modern HMDA, available since 2018, includes a wide variety of new data points. This analysis revealed several critical areas for future research that should be explored. These research questions can generally be categorized under four main areas:
1. Access to Credit
Evidence of exclusion from the mortgage market for LMI or minority borrowers continued. The modern HMDA dataset includes more detailed information on race and ethnicity than ever before. Combined with gender and income data research questions can focus on very specific subgroups of borrowers in any location.
2. Cost of Credit
One of the most important additions to HMDA has been a high level of detail on the cost of credit, including specific charges related to closing the loan, the interest rate and the rate spread. These new variables allow for a detailed look at mortgage lending products and lending institution changes to terms that hinder or enable access, particularly for minority borrowers facing structural barriers to wealth through homeownership.
3. Loan Channel
As IMCs have risen to market dominance, the loan channel, including the originator and purchaser of the loan, has become a critical factor in any analysis. Additional research is needed on the relationship between the loan channel and the cost of lending. Specifically, the cost on LMI or minority loan applicants, and their chances of closing a loan, can be looked at from a perspective of the market players that are meeting (or not meeting) those credit needs.
4. Lender Accountability
Many traditional banks have made commitments to racial equity in the form of increased mortgage products to underserved communities and borrowers of color — through both an increase in the number of loans and the expansion of the market due to equitable product and service innovation. The 2020 HMDA dataset is one way to set a baseline for how these institutions are progressing in meeting this promise.
