Introduction
As the federal bank agencies consider Community Reinvestment Act (CRA) reform, data on the patterns of lending to low- and moderate-income (LMI) borrowers and neighborhoods will help inform needed changes. For example, if non-banks not covered by CRA were found to be making significantly higher percentages of loans to LMI borrowers or neighborhoods than CRA-covered banks, stakeholders would want to understand the reasons and craft CRA reform proposals accordingly.
In November 2018, the Urban Institute released a report that looked at lending trends of banks compared to non-banks. They found that when the analysis considers all banks compared to all non-banks, non-banks are issuing a modestly larger percentage of loans to LMI borrowers and communities.[1]
We wanted to extend this analysis. We wanted to compare individual banks to individual credit unions and non-banks. CRA, after all, does not compare one segment of the lending industry to another segment in figuring out whether lenders are serving credit needs. Instead, it seeks to ensure that each individual bank is meeting the needs of the communities it serves. With this perspective in mind, NCRC sought to compare the individual banks to individual mortgage companies and credit unions. We wanted to see how this analysis could inform reforms to CRA.
Analysis/Key Findings
This is an overview of lending to LMI borrowers or census tracts (referred to here as LMI lending). All data is from the 2017 Home Mortgage Disclosure Act (HMDA), and includes lender types selected by the Federal Housing Finance Administration (FHFA) HMDA lender file provided by Robert Avery, project director, National Mortgage Database Program at the FHFA.
Lenders are analyzed individually to determine how many of their originated loans are LMI. Then each lender type is analyzed to determine the share of their activity that is LMI.
At its broadest setting, this analysis covers about 7.3 million loans. This includes all loans made by all lenders, for all purposes and loan types.
Lender types are as follows:
- Bank and bank subsidiaries and affiliates
- Credit unions
- Non-banks or Independent mortgage companies
Our key findings are:
- Overall, a greater percentage of banks made a greater percentage of loans to LMI borrowers and census tracts than non-banks and credit unions.
- A greater percentage of credit unions made a higher percentage of conventional home purchase loans to LMI borrowers and tracts than banks and non-banks.
- A greater percentage of banks had a higher percentage of conventional refinance and home improvement loans to LMI borrowers and tracts than credit unions and non-banks.
- A greater percentage of banks made a higher percentage of government-insured home purchase lending to LMI borrowers than credit unions and non-banks.
- The three lender types had similar percentages of government-insured refinance and home improvement loans to LMI borrowers.
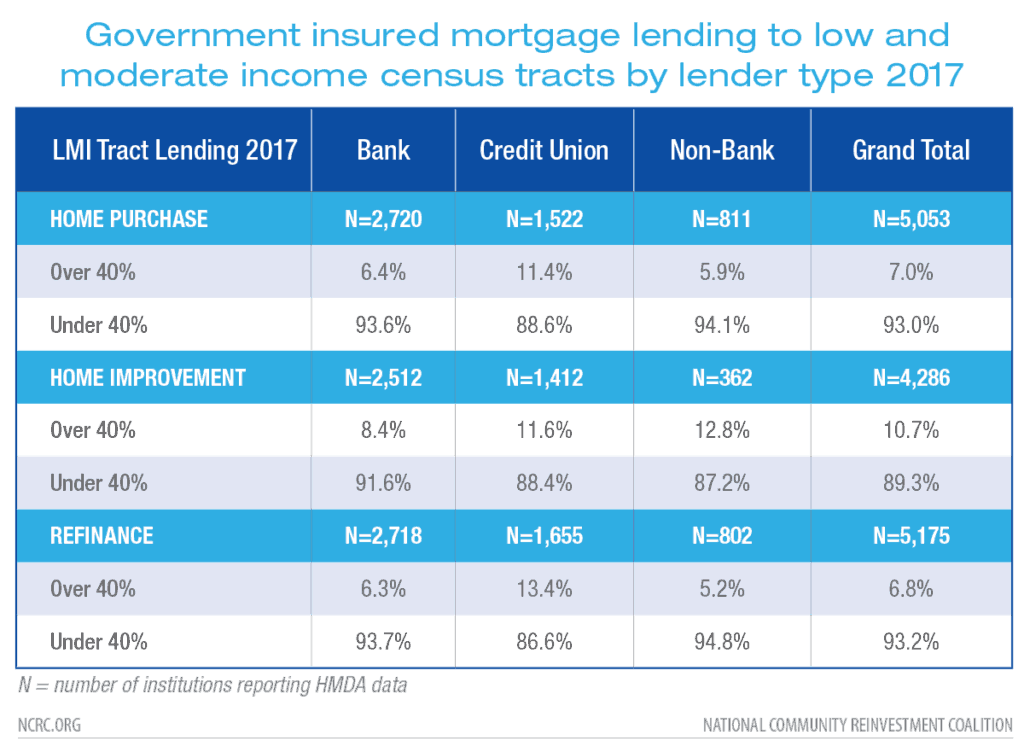
- A greater percentage of credit unions made a higher percentage of government-insured loans to LMI tracts than banks and non-banks.
- What seems to be driving the Urban Institute findings is the performance of some very large mortgage companies that are using Federal Housing Administration (FHA) loans to successfully serve LMI borrowers and neighborhoods.[2] However, when the analysis is conducted on an individual institutional level, banks appear to perform well compared to non-banks and credit unions.
Results
The following tables include conventional mortgages on single family, owner-occupied homes. Home purchase lending is limited to loans with a first lien position.
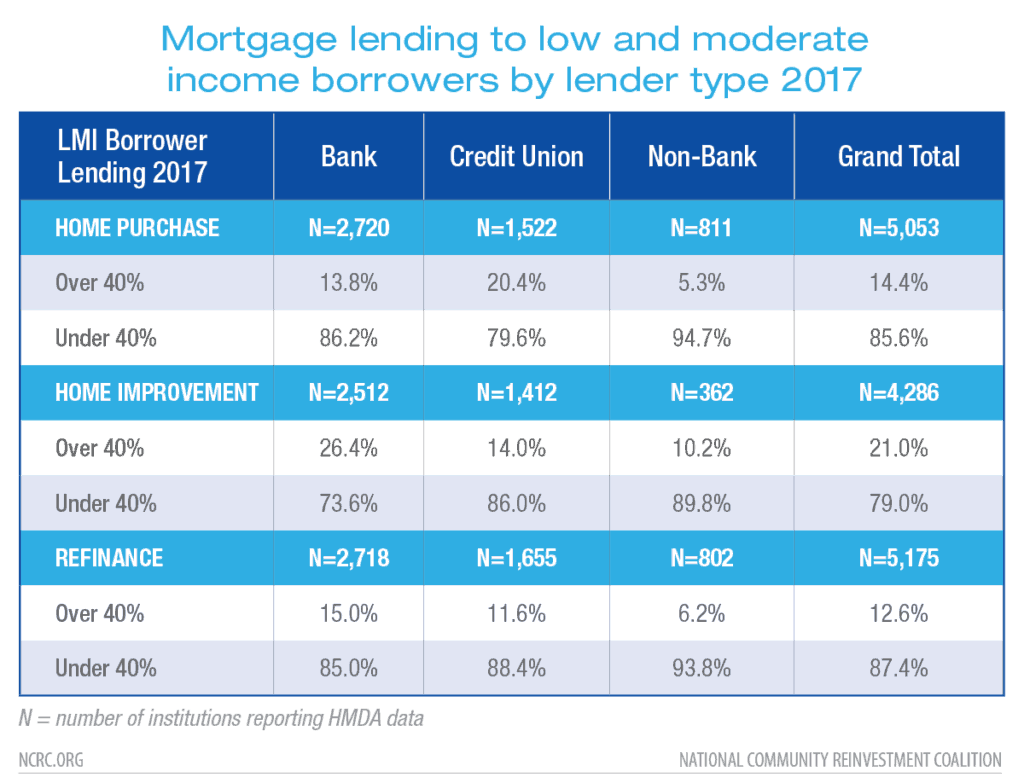
Almost 14 percent of banks made more than 40 percent of their home purchase loans to LMI borrowers in 2017 compared to 20.4 percent of credit unions and 5.3 percent of non-bank lenders. The 40 percent threshold appears to be an important tipping point that shows up in the data. Overall, banks made a higher percentage of their conventional loans to LMI borrowers than the other two lender categories when considering home purchase, home improvement and refinance lending.
Government-insured lending shows different patterns than conventional lending. For FHA/VA/RHS lending, banks usually made higher percentages of their loans to LMI borrowers than credit unions and non-banks.[3] In contrast, the three lender categories made similar percentages of loans to LMI census tracts.
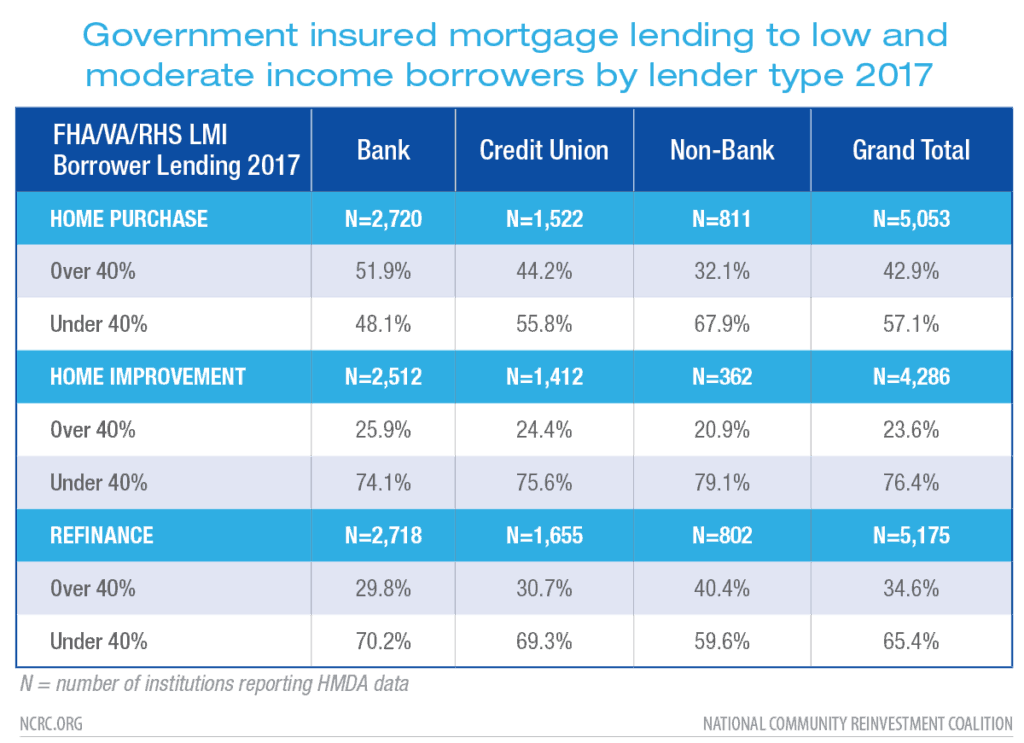
Out of the 2,720 banks that reported government-insured, home purchase lending in 2017, 51.9 percent made more than 40 percent of those loans to LMI borrowers. This compares with just 44.2 percent of credit unions and 32.1 percent of non-banks. This is surprising given the withdrawal of many banks from the government-insured lending space. But it appears that within that smaller number of government-backed loans they make, most banks clearly favor LMI borrowers. Non-banks are more likely to use government-backed lending for middle- and upper-income borrowers.
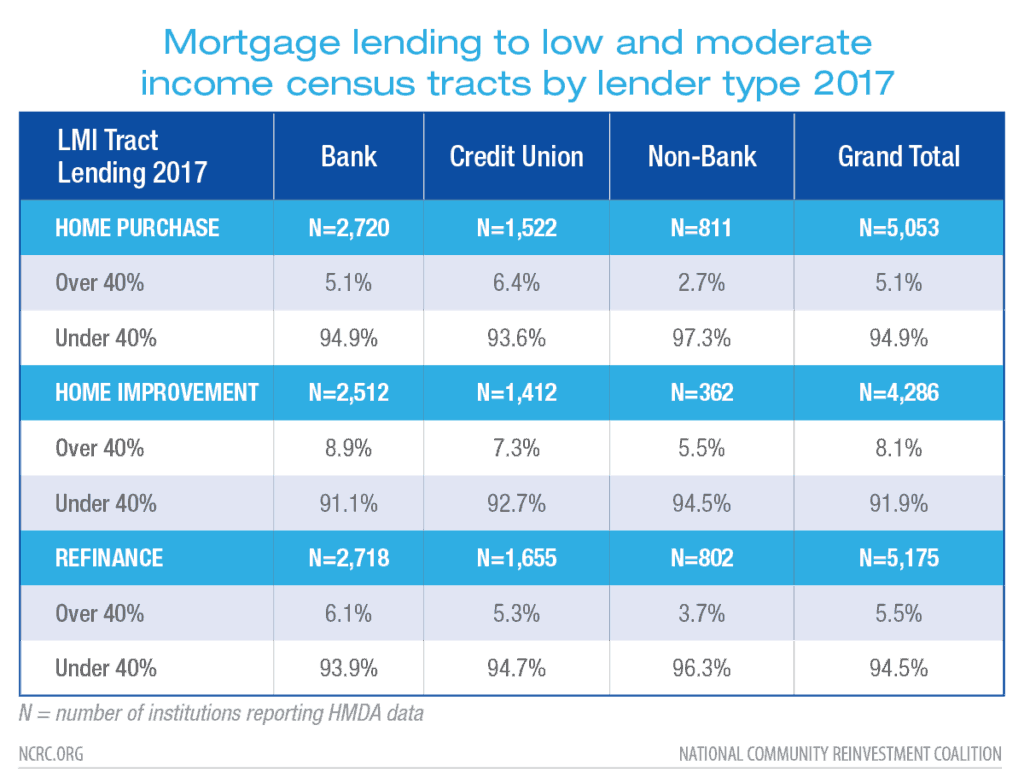
Lending to LMI neighborhoods reveals a much closer alignment among the different types of lenders.
Banks, credit unions and non-banks hold very different market shares based on the loan type and purpose of the loan. For loans on single family, owner occupied homes, the following market shares existed in 2017.
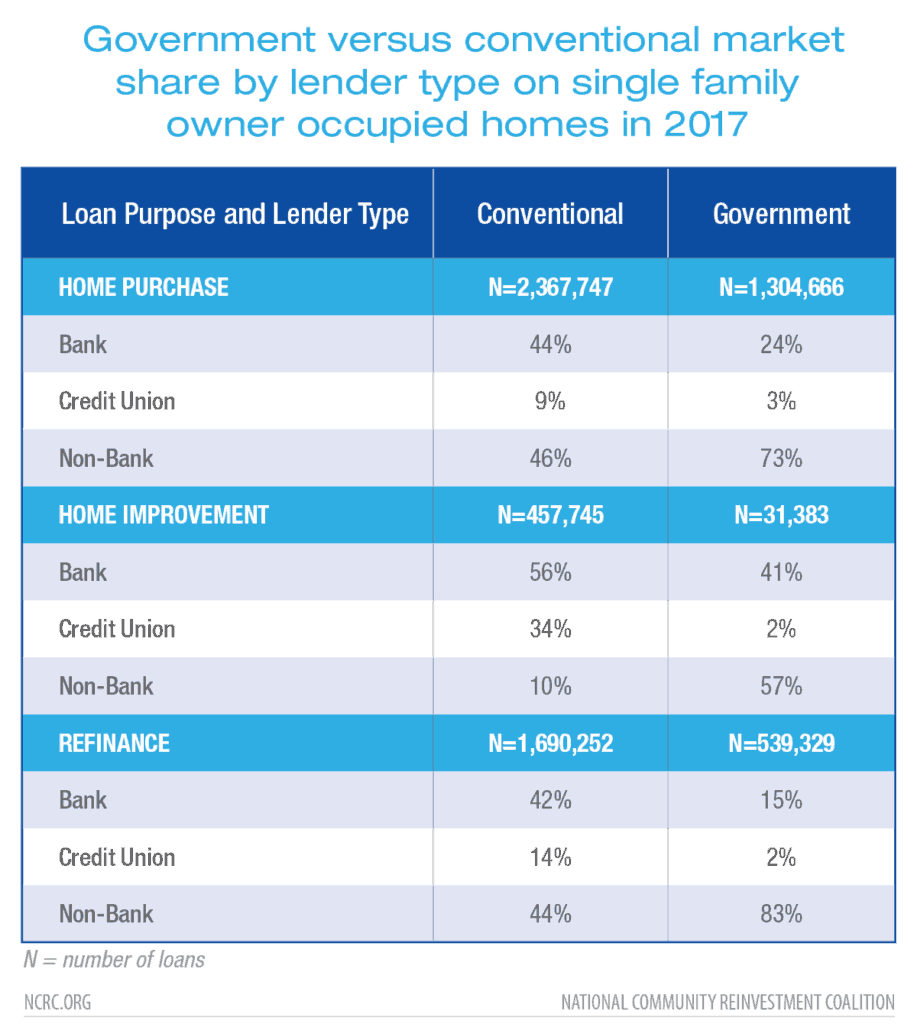
Conventional lending shows a relatively even distribution between banks and non-banks; banks made 44 percent of conventional home purchase loans and 42 percent of refinance loans, which is quite similar to the share of conventional loans made by non-banks. The story is dramatically different in the government-insured loan space. Here banks made just 24 percent of home purchases, compared with non-banks at 73 percent. Non-banks dominated government refinance loans even more, making 83 percent of government-backed refinance loans compared with banks at just 15 percent. The differences in market share should be kept in mind when comparing the performance of the three categories of lenders. The comparisons for conventional lending are perhaps the most robust since the market shares are the most similar.
Conclusion
This analysis suggests that CRA has effectively motivated banks to issue a significant share of their home lending to LMI borrowers and communities compared to lenders that are not covered by CRA. Stakeholders should not interpret this analysis to suggest that changes to CRA are not needed. On the contrary, NCRC advocates a number of changes to CRA to make sure it remains effective as the lending industry undergoes profound changes as described in our recent Congressional testimony. In addition, NCRC supports applying CRA requirements to independent mortgage companies along the lines of Massachusetts’ CRA law and as outlined in the American Housing and Economic Mobility Act, which has recently been introduced in the Senate and the House. This new legislation would also strengthen requirements for credit unions to serve low- and moderate-income communities.
Jason Richardson is Director of Research and Evaluation and Josh Silver is a Senior Advisor at NCRC.
[1] Laurie Goodman, Jun Zhu, and John Walsh, The Community Reinvestment Act: Lending Data Highlights, Urban Institute, November 2018, see page 2 table, “Single-Family LMI Mortgage Lending Bank versus Nonbank,” https://www.urban.org/research/publication/community-reinvestment-act-lending-data-highlights
[2] NCRC found that 30 independent mortgage companies made over half of all loans to LMI borrowers and census tracts reported by non-banks. One very large mortgage company made 10 percent of all of the loans that non-banks reported to LMI borrowers and tracts.
[3] FHA – Federal Housing Administration, VA – Veterans Administration, RHS – Rural Housing Service. Each of these agencies provide loan guarantees.

I have to thank you for the efforts you have put in writing this site.
I’m hoping to see the same high-grade blog posts by you later on as well.
In fact, your creative writing abilities has encouraged me to get my very own blog now 😉