- Non-banks continue to dominate the home lending market, making 56.4% of home purchase loans and 58.1% of refinance loans in 2019. This is slightly changed from 2018, when 57.2% of home purchase loans and 56.1% of refinance loans were made by non-banks.
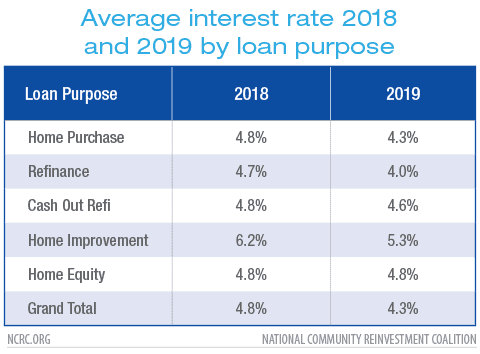
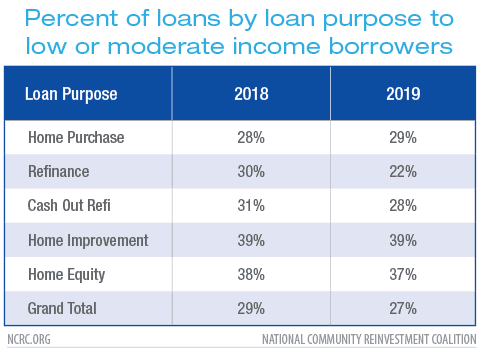
- In 2018, 69% of refinance loans went to middle- or upper-income borrowers, a figure that increased to 76% in 2019. LMI homeowners are largely excluded from the benefits of refinancing.
- Black and Hispanic borrowers and LMI borrowers of any race did not substantially improve their market share in 2019.
- Black borrowers used government insured lending such as FHA, VA or RHS to make 60% of their home purchases. Hispanic and LMI borrowers used these government insured loans 48% and 41% of the time, respectively, yet banks avoid making these loans. Only 4 of the top 50 FHA lenders in 2019 were banks.
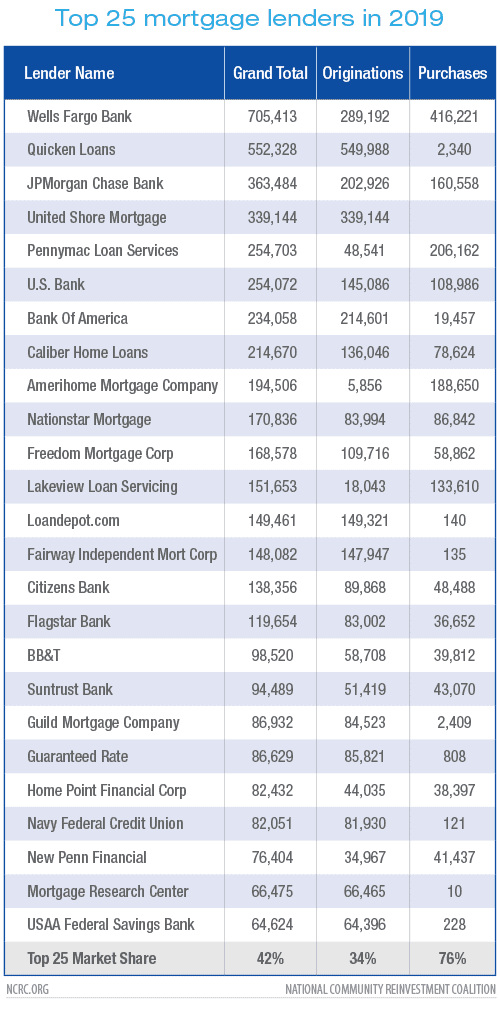
- Quicken Loans and United Shore Mortgage were the largest loan originators in the country with 550,000 and 339,000 loans, respectively. When including purchased loans, Wells Fargo still leads the country with over 700,000 loans in 2019.
- In both 2018 and 2019, just 15% of refinance lending went to borrowers who were Black, Hispanic, Hawaiian or Native American.
- 9.3 million loans were originated in 2019, which is 1.6 million more loans made compared with 2018.
- Most of the increase was due to an increase in refinance and cash-out refinance loans from 2.3 million to 3.8 million loans.
The Consumer Financial Protection Bureau (CFPB) released the 2019 Home Mortgage Disclosure Act (HMDA) data on June 24, 2020, detailing mortgage lending information from nearly all lenders in the United States. HMDA offers details on 9.3 million originations resulting from over 17.5 million applications. The CFPB estimates that HMDA includes about 88% of mortgage originations made in 2019, making it the largest and most detailed dataset on mortgage activity. HMDA is the most complete record of who makes mortgage loans, where they make them and to whom they make them. It is a critical tool for the public and local leaders to ensure lenders are not redlining in their communities, for consumer advocates who serve low-and moderate-income (LMI) or minority communities, regulators and lenders that want to make sure they are fulfilling their chartered obligations.
As of 2018, the level of detail that HMDA offers was greatly increased thanks to the impact of the 2010 Dodd-Frank Act. HMDA now includes detailed information on the race, gender, age and income of mortgage applicants. It also offers unparalleled detail on the cost of those loans, including the interest rate, closing costs, loan amount, property value and loan features.
NCRC offers all members help with analysis of lending in their communities. (Here’s an example). Please contact NCRC if your organization would like a deeper analysis of the mortgage and business lending activity in your community. Not a member? Join here.
In 2019, HMDA included 9.3 million loans, or over 1.6 million more loans compared with the 7.7 million loans made in 2018. This doesn’t mean more Americans were buying homes though, just 167,358 of that increase was due to home purchase lending. Almost 1.5 million more refinance loans were made in 2019, as existing homeowners took advantage of ultra-low interest rates to refinance their existing debt.
In our initial analysis, NCRC found that most of the trends we observed in 2018 continued in 2019.[1]
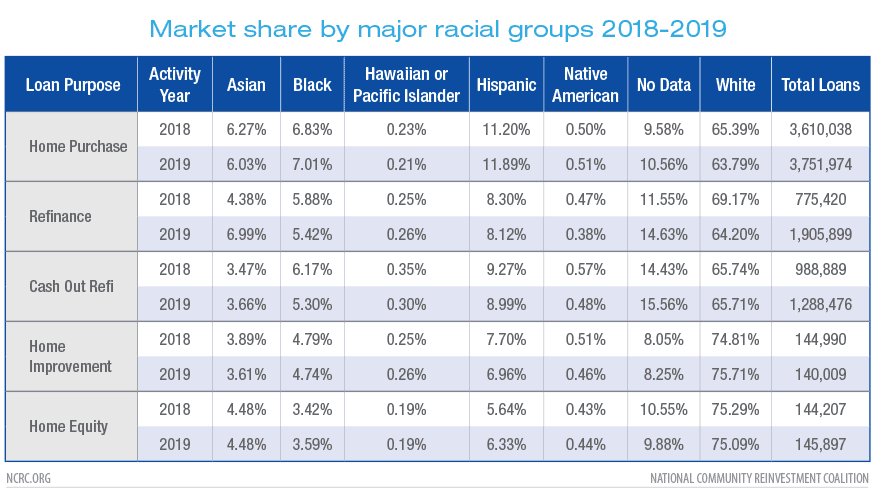
Although the share of home purchase loans made to White borrowers declined in 2019 from 65.39% to 63.79%, that doesn’t necessarily mean that minority borrowers were seeing corresponding increases in their market share. Black borrowers were 6.82% of 2018 home purchases and were still just 7.01% in 2019, far below their 15% share of the American adult population. Hispanic borrowers also saw marginal improvements in their share of the home purchases made in 2019. Asian borrowers saw their share of home purchases decline. However, they captured a much larger portion of the refinance lending frenzy of 2019 than compared to 2018, moving from 4.38% to 6.99%.
As in 2018, we saw an increase in loans without any indication of the race or ethnicity of the borrower. All of the loan purposes show increases in loans without this critical data, including about 15% of refinance lending. At a time when the discussion about racial inequality, segregation and redlining dominates the national discourse, the increasingly opaque data on home lending is troubling. While many more borrowers are using the internet to apply for mortgage loans, lenders have a responsibility to encourage the reporting of race and ethnicity where applicable. This growing blind spot in HMDA threatens the validity of the overall dataset.
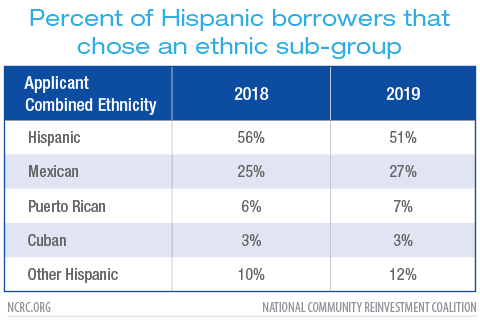
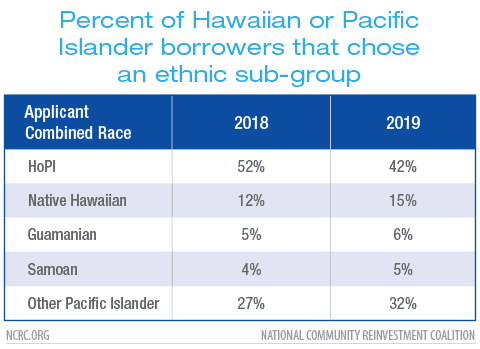
2018 saw the introduction of ethnic and racial subgroups to HMDA. This was a response to community advocacy from Hispanic, Asian and Pacific Islander communities. These groups are not homogenous, and by grouping them together we can miss evidence of excluded populations that are locked out of the mortgage system. NCRC has developed methods and analyses using these new data points for our members.
Despite widespread resistance by the lending industry, the inclusion of the option to report a sub-group has proven popular with borrowers. In 2019, 49% of Hispanic borrowers selected at least one possible sub-group, compared to 44% who did so in 2018.
Among Asian borrowers 68% identified a racial sub-group in 2019, up from 59% the previous year. This additional data will help identify Asian borrowers who may face discrimination or other structural barriers in the mortgage market.
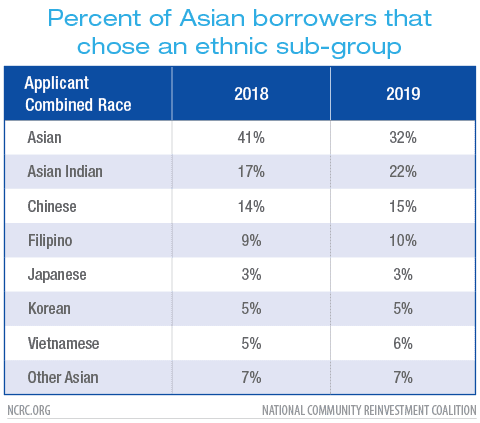
For Native Hawaiian and Pacific Islanders, the ability to explore racial sub-groups offers opportunity for Hawaiian consumer advocates who have long complained that they are excluded from the Hawaiian housing market.
LMI borrowers are those applicants who report an income that is 80% or less of the median family income for the metro area in which they reside. Lower-income borrowers often have weaker credit scores than higher-income borrowers, and they are more likely to be younger and of a race other than White. In 2019, LMI borrowers received 29% of home purchase loans, a marginal increase from 2018. However, the share of refinance loans made to LMI applicants went down sharply from 30% in 2018 to just 24% in 2019. Just 15% of these refinances went to Black, Hispanic, Native American or Native Hawaiian borrowers. This is particularly troubling, as it indicates that the lower interest rates that resulted in a massive increase in refinance lending in 2019 primarily benefited White and Asian middle- and upper-income owners. This is likely due to the tightening of credit and other requirements that lenders implemented. By excluding LMI borrowers from the ability to refinance, they are less able to build wealth at the rate of higher-income homeowners, expanding an already growing wealth gap that has stark class and racial implications.
Non-bank independent mortgage companies not affiliated with a bank or credit union continued to dominate home purchase lending, reporting 56.4% of all originations in the data this year. This is a slight decrease from the 57.2% of those loans that they made in 2018. However, for the refinance lending that was critical for lenders in 2019, non-banks increased their dominance, making 58.1% of those loans compared with 56.1% in 2018.
The share of loans using government insurance was unchanged from 2018, when 33% of home purchase loans on owner occupied single family homes were made using FHA, VA or RHS insurance.
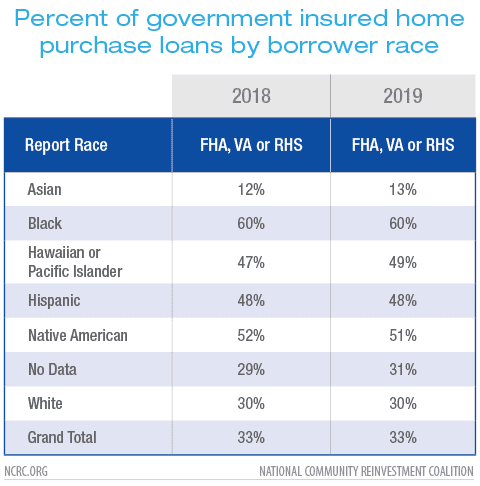
Sixty percent of home purchase loans to Black home buyers and 48% of loans to Hispanics made use of government insured FHA, VA or RHS lending programs. Hawaiian and Pacific Islander and Native American borrowers are also dependent on these loans. LMI borrowers used these loans 41% of the time in 2019, compared with just 30% of the loans made to middle- and upper-income borrowers. Government insured loan programs like FHA offer lower down payment and easier credit requirements than most conventional loans but often cost more for the borrower. There are conventional products offered by Fannie Mae and Freddie Mac that mimic FHA lending, but it does not appear that lenders made a large number of these, instead offering LMI and minority borrowers the higher-cost government insured alternatives.
Banks have generally reduced or eliminated their lending with these programs, leaving minority borrowers disproportionality served by non-banks. Among the top 50 FHA lenders in 2019 just four were banks. Lacking large assets or branches, non-banks are not regulated under the Community Reinvestment Act (CRA). This potentially leaves minority borrowers exposed to issues such as steering, redlining or other predatory practices that CRA examinations of banks take into consideration. Modernization of CRA should include the expansion of CRA coverage to these non-banks, as some states have already done on a smaller scale.
This reliance on non-banks may also have consequences for minority borrowers as we enter what many expect to be the worst recession since the Great Depression due to the impact of the COVID-19 pandemic. During recessions in the past, non-banks have generally exited the market. If banks are not making the kind of loans that LMI and minority borrowers rely on, they will be further excluded for years to come as the recession culls the number of non-banks in operation.
Lenders make loans in two ways. They either originate the loans themselves where those lenders accept applications and make a credit decision or they buy a loan from another lender that has already approved the applicant. Both are important to recognize when assessing the size of the mortgage market and the lenders that operate in it. In 2019, Quicken Loans greatly expanded its lead as the largest originator of mortgage loans in the U.S., with 549,988 loans originated in total. This dwarfed the next largest originator, United Shore Mortgage with 339,144 loans. Both of these non-banks easily exceed the 289,192 originations reported by Wells Fargo. But Wells Fargo purchased far more loans than it originated. When those loans are included, Wells Fargo comfortably dominates the mortgage market, with 705,413 loans in 2019. Among the top 25 mortgage lenders, the role of non-banks cannot be overstated. They are exempt from the requirements of CRA to reinvest in communities based on credit need, and more vulnerable to recessions. The reliance on non-banks for credit to minority borrowers is a threat to the availability of mortgage credit in LMI and minority communities nationwide.
Likewise, the largest lenders dominate the mortgage market to a large degree. Out of the 5,479 lenders in 2019 that reported originations or purchased loans, 42% of the 11.6 million originated and purchased loans were reported by those top 25 lenders.
Purchased loans can also lack important data such as borrower income and race, a loophole allowed by HMDA and which has taken on increasing importance as large lenders rely more on purchased loans.
Another important loophole was created by the S.2155 bill from 2018, which allowed some smaller lenders to not report the additional data required under Dodd-Frank despite the fact that most of that data is collected as a normal part of the loan process. In 2019, this exemption includes 43.3% of lenders but just 2.6% of all loan applications. This has a disproportionate impact on smaller and rural communities, where credit is already difficult to access.
HMDA remains the most important tool available for assessing the level to which banks and non-bank lenders are meeting the mortgage credit needs of the whole country. While the CFPB has significantly improved access to this data since 2018, it remains a complex set of data that is difficult for the general public to access or work with. NCRC offers detailed analysis of this data to our members, but we also want to see this data be broadly available to the public in formats that are easily accessible.
This data is also continually under threat. Although the Dodd-Frank Act of 2010 mandated the reporting of additional data such as interest rates and loan costs that were already collected by lenders in the course of originating loans, the industry has campaigned to restrict that data from public view. This prevents communities from understanding if they continue to suffer the effects of redlining, steering or segregation. The CFPB is also expected to issue a notice of proposed rulemaking to further exempt more small lenders from having to report their loan data. This disproportionately impacts small rural communities which already have a harder time accessing mortgage credit.
Jason Richardson is NCRC’s director of Research & Evaluation.
Jad Edlebi is NCRC’s GIS specialist.
[1] Unless otherwise noted, this analysis is for originated, owner occupied, first lien, 1-4 unit site built loans. Loans that lacked an identified loan purpose were excluded.
