EXECUTIVE SUMMARY
COVID-19 exposed deep economic and social fault lines nationwide, with profound implications for how we attract investment to our poorest communities and the impact that investment has on low- and moderate-income (LMI) and minority populations.
The pandemic also made clear what was already going on before it: While a small number of cities were booming, most were not. NCRC’s 2019 report on gentrification and cultural displacement identified a small group of boomtowns that experienced large scale gentrification and notable displacement of longtime minority communities. But they were rare. Most cities and towns were struggling. Their problem was stagnation and disinvestment, not gentrification or displacement. Most LMI communities in most places remained mired in poverty and lacked critical investment.
Widespread protests in 2020 against systemic racism and police brutality erupted in a nation that was already suffering not only from a pandemic but also from the brutality of chronic poverty and economic distress.
COVID-19 struck a nation that was already mostly struggling. Recovery in most places will be even more challenging than in those where investment was already concentrated. Unless we act now.
In this follow-up report, covering data from 2012 through 2017, NCRC once again found that gentrification and displacement was highly concentrated, and that most low-income neighborhoods, and the vast majority of cities, continued to deal with a chronic lack of investment.
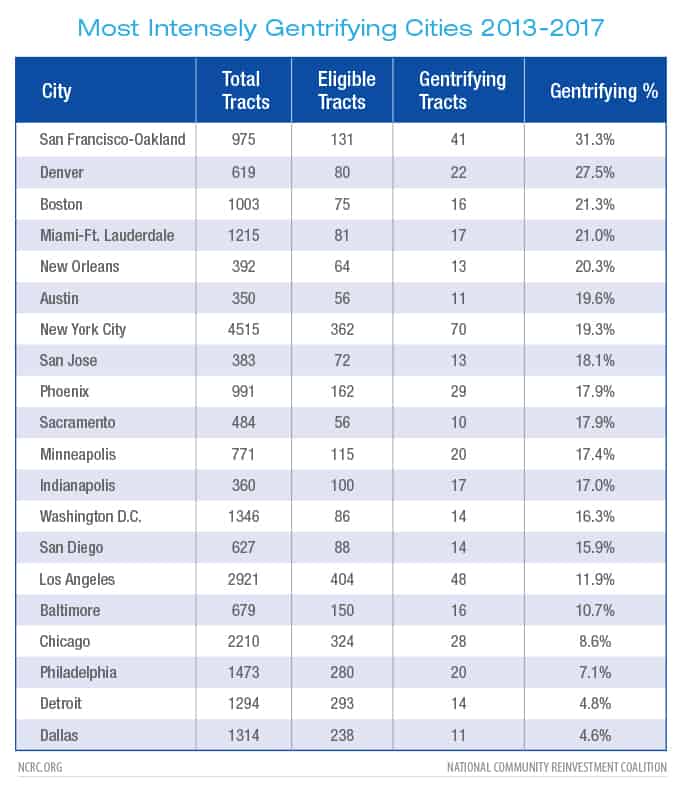
San Francisco, California, took the title of most intensely gentrified city in America during 2013-2017, followed by Denver, Colorado, and Boston, Massachusetts. They had the largest share of their vulnerable neighborhoods that gentrified during that time period. Washington, D.C., ranked No. 1 in the 2019 report, dropped to No. 13. Gentrification and displacement continued there, but it surged elsewhere.
In this report, we also took a closer look at Opportunity Zones. Since their debut in 2018, Opportunity Zones raised fears that they might exacerbate gentrification and the displacement of LMI and minority communities. The role that Opportunity Zones will play in neighborhood development, gentrification and displacement is not well understood, and no real data is yet collected on investments in the Opportunity Funds that drive this process.
For the most part, OZs were indeed the places in the most dire need of investment. Economic inequality was higher, home values and incomes lower and fewer families owned their homes than in any other part of the city. Despite the fact that 69% of gentrified neighborhoods were either in or adjacent to an OZ, the majority of Opportunity Zones were in fact those places that needed the most help. In the 921 cities that saw very little gentrification in this report, all LMI neighborhoods were struggling, but the Opportunity Zones were usually the worst off.
There was a stark racial divide in these communities as well, with gentrifying neighborhoods overwhelmingly populated by people of color. The average minority population of the neighborhoods included in this study was 50%, but that figure rose to 77% in areas we determined to have gentrified. Homeownership in both gentrifying neighborhoods and OZs was significantly lower than in the rest of these cities as well. Often, the people who lived there, overwhelmingly people of color, were not benefiting from the investment that flowed there. As the Philadelphia Federal Reserve found, renters are more vulnerable to displacement as their communities gentrify, and unlike owners, they reap none of the rewards that rising home prices and rents can bestow.
NCRC once again found that gentrification remains a significant threat to minority and LMI families in some of the largest and most prosperous parts of the country. These cities are home to over 14% of all Americans. In these cities, Opportunity Zones overlap gentrification to a high degree.
Throughout the rest of the country the narrative changes a great deal, with disinvestment more common throughout nearly all LMI neighborhoods. High levels of inequality as well as low home values and incomes prevented many families from building wealth at all. Here Opportunity Zones highlighted the neighborhoods that have the greatest need.
This study reinforces the need for the Community Reinvestment Act (CRA), and its modernization and expansion to adapt to the realties of chronic disinvestment and poverty across most of the nation. CRA is important for driving investment to lower-income communities and families, a fact that persists despite the appearance of substantial gentrification in some of the largest cities we looked at. Chronic disinvestment in lower-income communities will undoubtedly be exacerbated by the COVID-19 crisis. In those communities where gentrification existed, the ability for residents to resist displacement will be harder, and in most of the country it will become even harder to attract investment at all. The data underscores the need for a more equitable system and policies that help more communities attract investment without displacing the families that live there.
INTRODUCTION
The 2017 “Tax Cuts and Jobs Act” created a new mechanism which allows investments in distressed neighborhoods to be sheltered from tax liabilities. Opportunity Zones (OZs) were supposed to be economically distressed communities where investment in businesses are given preferential tax treatment. By the end of 2018, 8,764 census tracts, neighborhoods in rural and urban areas with indications of economic distress were nominated by governors and designated as Opportunity Zones by the Secretary of the U.S. Treasury.1 OZs are controversial. Critics of OZs have voiced concern that they will fuel “gentrification on steroids” in urban areas,2 accelerate displacement3 and intensify rather than solve the problem of a lack of affordable housing in many cities.4 Proponents of the law argued that OZs would provide extensive tax benefits to industry and create the circumstances for industries to remain in or relocate to low-income areas, providing employment and other opportunities to low-income residents. However, if the investments in OZs do not benefit low-income residents, they simply become the equivalent of “mini tax havens for the rich” transplanted to low-income neighborhoods.5
In this report, we looked at newly gentrifying neighborhoods in the 2013-2017 time-period. We also compared them with OZs. Our analysis focused on OZs located in urban areas and their correspondence with the neighborhoods in towns and cities where there were indications of gentrification. We examined urban areas because a majority of the U.S. population lives in cities and towns of over 10,000 residents, and also because gentrification is an issue that impacts urban areas.6 A spatial overlay of the newly announced OZs with gentrifying areas allowed us to compare economic and social conditions within them and also with other urban neighborhoods. The period following the conclusion of the Great Recession to about 2012 has been one of ongoing but uneven economic recovery for urban areas.7 We assessed an uneven pattern of gentrification in urban areas since 2012. Our analysis answered questions about where neighborhoods with recent indications of gentrification are located, whether these gentrifying neighborhoods are close to OZs and how OZs differ from other urban neighborhoods in their socioeconomic status and demographics.
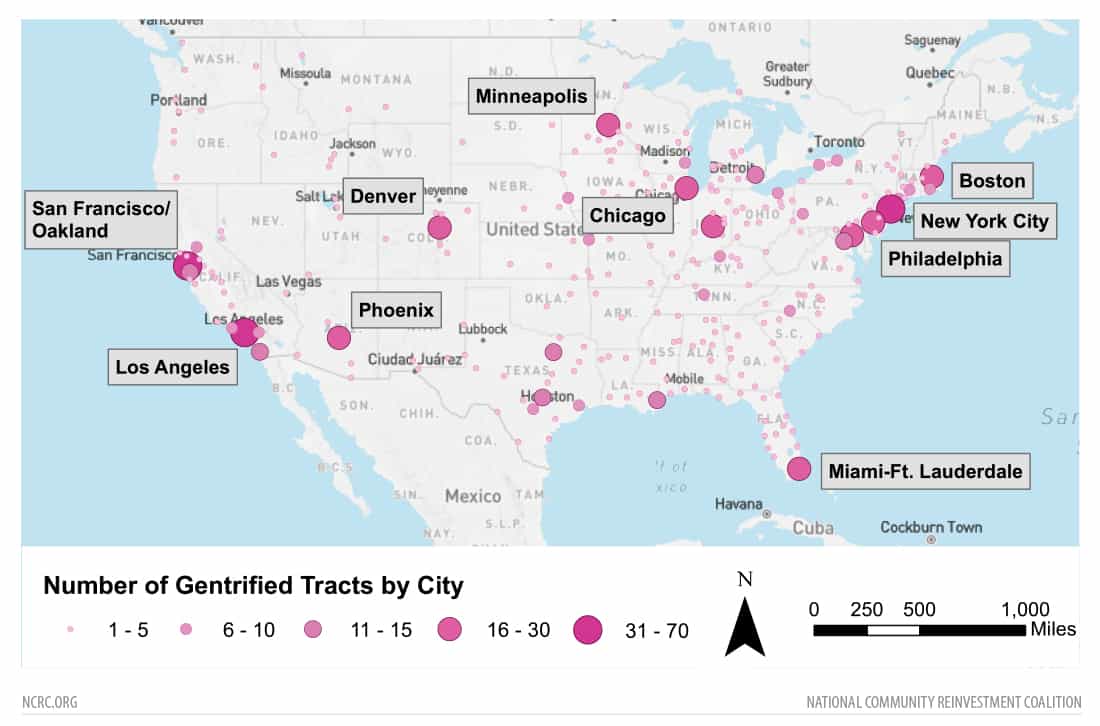
We identified 954 neighborhoods with indications of gentrification in the period 2013-2017. These were concentrated in 20 “intensely gentrifying” metro areas, where a high percentage of low-income and low home value neighborhoods that were eligible for gentrification in 2008-2012 showed indications of gentrification. In each of these cities at least ten neighborhoods gentrified during the 2013-2017 period. Nationally, half of all of the gentrifying neighborhoods were in these 20 cities. The top cities for intensity of gentrification during the period are San Francisco-Oakland, Denver, Boston, Miami and New Orleans. This list changed from the one in our previous report, which covered the period 2000-2012. Previously, Washington, D.C., had indications of the highest intensity of gentrification, but dropped to 13th in the new report. All of the top 20 cities in this report were amongst the top 30 in intensity during the earlier report period, 2000-2012.
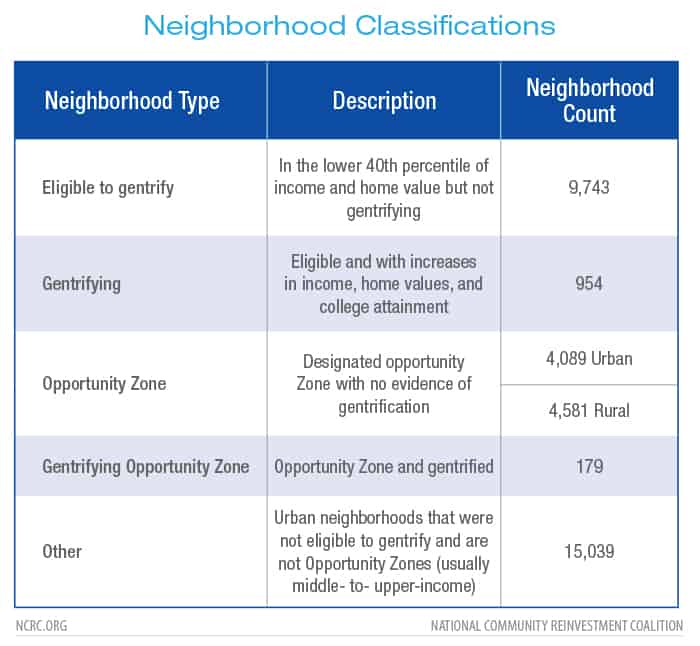
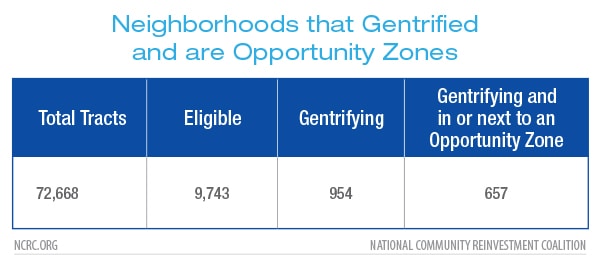
The analysis divided neighborhoods into five categories: neighborhoods that were eligible for gentrification but did not gentrify, gentrifying neighborhoods, OZs, gentrifying OZs and all other urban neighborhoods (primarily middle- to upper- income areas). The largest number of neighborhoods are in the other urban neighborhood category, followed by neighborhoods eligible to gentrify that did not and then the urban OZs. The number of neighborhoods with indications of gentrification was much smaller than the number of urban OZs, but there was considerable overlap and adjacency of these two categories. Sixty-nine percent of gentrifying areas were within or next to an OZ and 179 of the gentrifying neighborhoods were also categorized as OZs.
Despite their degree of overlap, most gentrifying areas had very different economic conditions than OZs. Indications of economic prosperity – household income, home value and college education – quickly increased in gentrifying areas. Rents rose fastest in gentrifying and middle- to upper-income urban neighborhoods, creating housing affordability pressures. This contrasted with the OZs, which on average had lower population, higher percentages of black residents, lower median home value, lower median household income, lower rates of owner occupancy, low college education levels and greater economic inequality. They also had the lowest median rent and high levels of business and residential vacancy. In fact, nearly 84% of the urban OZs overlapped with CRA designated low- to moderate-income neighborhoods. Usually, OZs were among the most distressed neighborhoods in their communities.
Our findings suggest that concern about the impact of OZs is warranted, but that the designation of an area as an OZ, especially in most cities where gentrification is not widespread, is usually an indicator of a neighborhood in economic distress with high levels of income inequality. However, because of the high degree of adjacency of OZs and urban neighborhoods experiencing gentrification, OZs may be especially prone to gentrification as they are impacted by the spill-over effects from neighborhoods next to them. The primary problem of the newly designated OZs is not so much how they were selected, but whether or not they will benefit their residents, and not just wealthy investors seeking to reduce their tax liability. While OZs usually represent neighborhoods with great economic need, the “Tax Cuts and Jobs act” of 2017 failed to establish sufficient metrics to evaluate the outcome of investments or how they are benefiting the residents of OZs. The minimal restrictions on investment types, and the absence of metrics for measuring success makes investments under the law vulnerable to exploitation and “gaming,” which favors high returns over social benefits.
METHODS
The present study built on the methods employed in our previous study covering neighborhood change and gentrification during 2000-2012.8While the prior study utilized Decennial Census 2000 and 2010 and American Community Survey (ACS) data which was normalized to account for census tract boundary changes, the present study relied on five-year ACS data collected during the periods 2008-2012 and 2013-2017. Some of the ACS data, especially the demographic data, has large margins of error. This is because the data is drawn from surveys taken during a five-year period. Consequently, we did not analyze displacement by race and ethnicity, a task that requires precise counts of the residents in a neighborhood. Instead, the present study focused on socioeconomic data related to income, home value and education level to assess neighborhood-level gentrification.
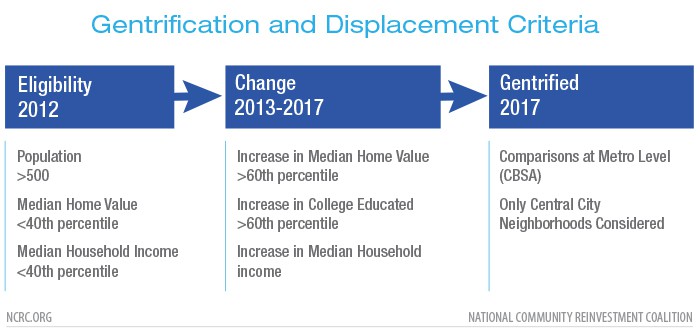
This study directly compared census tracts, hereafter referred to as neighborhoods, in the central city portion of urban areas. Neighborhoods were separated into five categories: those which were eligible for gentrification, those which were gentrifying, neighborhoods designated as OZs, gentrifying OZs and all other urban neighborhoods which were not gentrifying nor been designated as an OZ (Table 1). Due to the overlap of the two categories, we removed the 179 neighborhoods that were labeled “gentrifying OZs” from the statistical analysis.
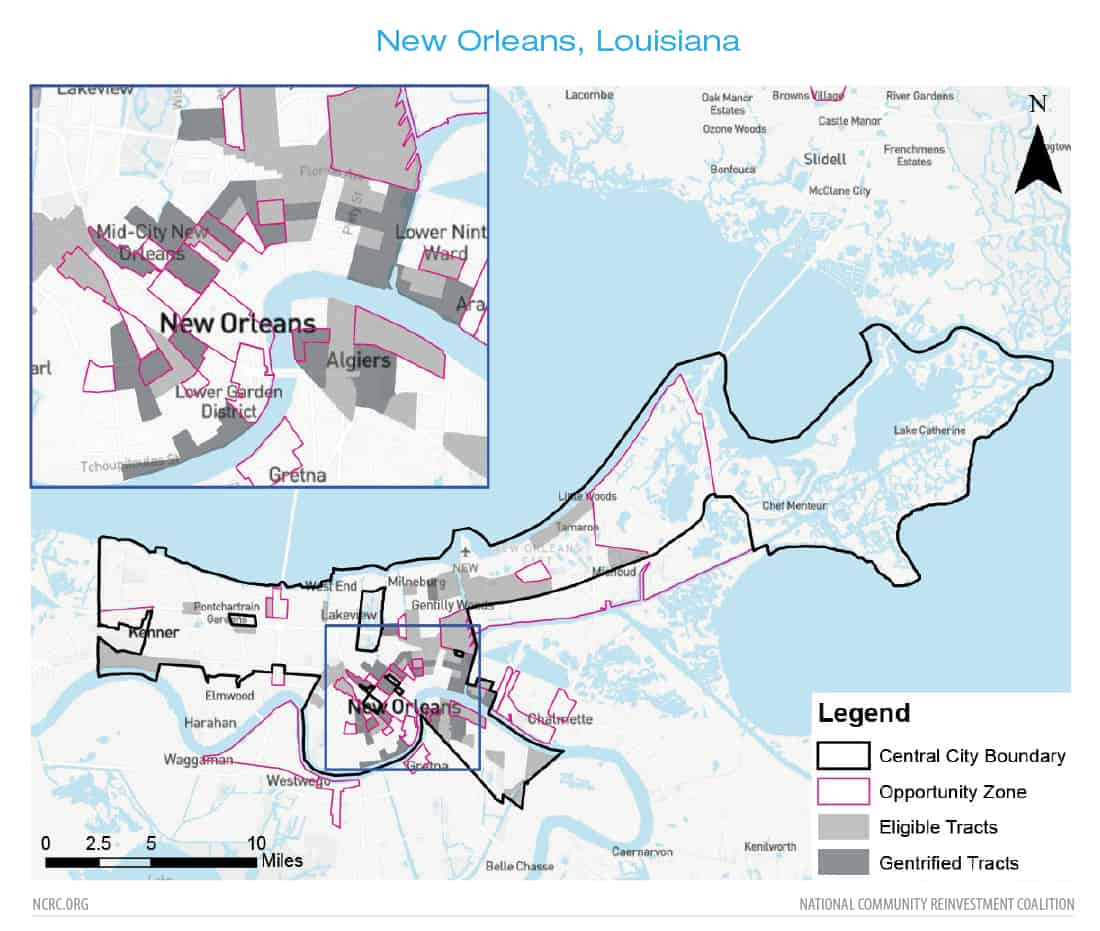
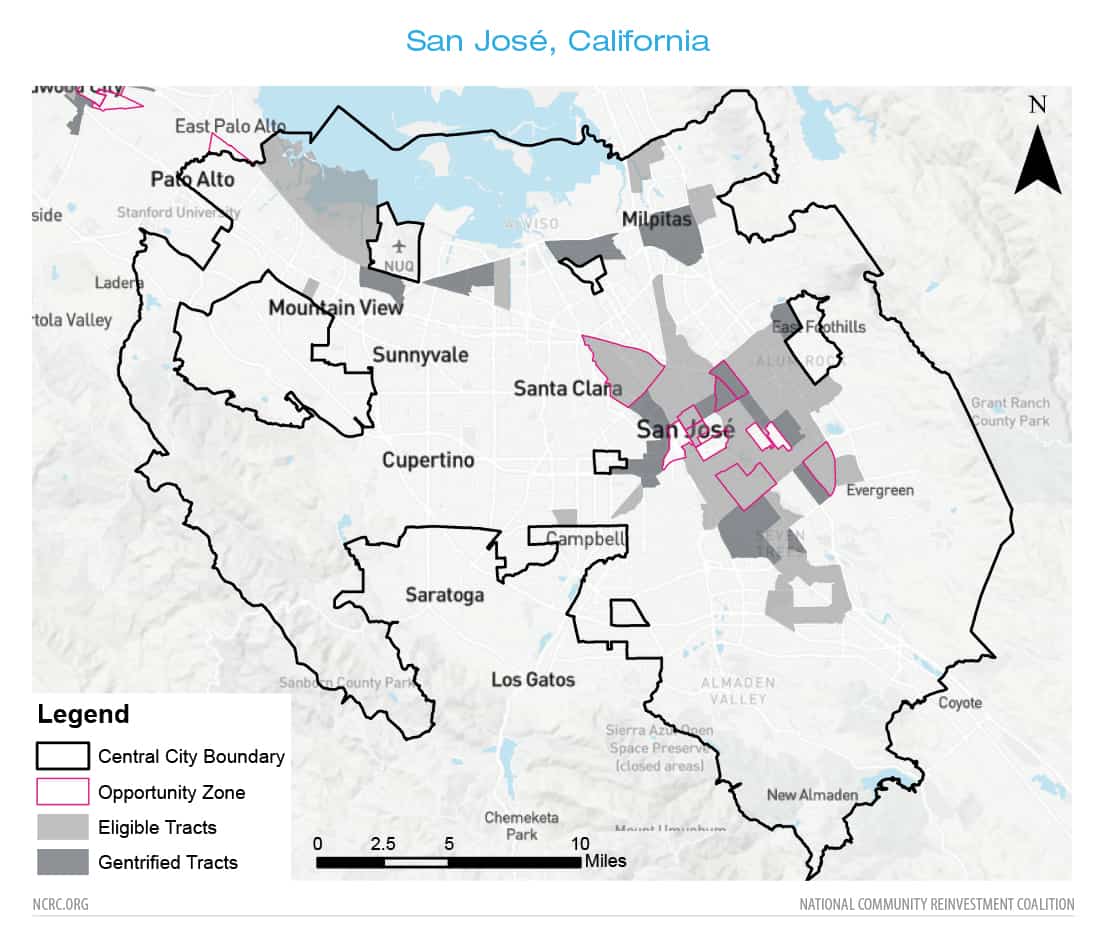
A descriptive analysis of the average, or mean value, was conducted and then the differences were analyzed between categories of urban neighborhoods in cities with at least one gentrifying neighborhood and other cities without any indication of gentrification. Intensity of gentrification was quantified as the percentage of neighborhoods which were gentrifying out of those which were eligible to gentrify. Only urban central city neighborhoods were considered. These neighborhoods were defined as those that are part of the central city of a metropolitan area as defined by the Office of Management and Budget (OMB).9 Figures 2a and 2b show a sample of the central cities boundaries in two metro areas. The central city indicator confines eligibility to the more concentrated urban area in the examples of New Orleans, Louisiana, and San Jose, California. Areas excluded from the central city neighborhoods appear as “holes” in the maps. Examples of these are parks, government installations and airports, which are not densely populated residential areas. The maps show how eligible and gentrifying neighborhoods were contained in central city areas, while OZs were not restricted by this qualification and extended to lower density suburbs and exurban areas.
RESULTS
National Level – Gentrification and Opportunity Zones
Nationally, out of the 72,668 neighborhoods that were evaluated, 9,743 neighborhoods were eligible for gentrification. Of these, 954 or 9.8%, had indications of gentrifying during the 2013-2017 time period (Table 2).
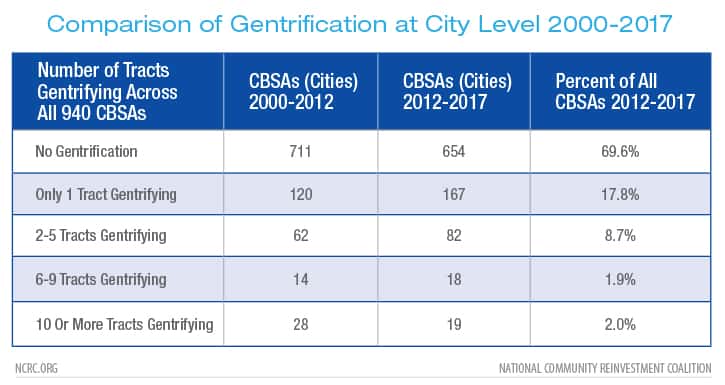
In our prior study of gentrification between 2000 and 2012, we found that gentrification was relatively rare in metropolitan areas in the U.S. However, gentrification was highly concentrated in the largest and most economically dynamic cities. The current analysis confirms the pattern, with 654 of the 940 designated metro areas (CBSA) having no indications of gentrification, while 37 cities contained more than five neighborhoods which were undergoing gentrification (Table 3). This means that less than 4% of U.S. cities showed indications of extensive gentrification during the period. However, during the past five years more cities experienced at least some level of neighborhood gentrification than in the prior period.
Gentrification is an urban phenomenon, while OZs have been designated in both urban and rural areas. Table 4 establishes the number of neighborhoods in rural and urban areas across the U.S. Of the 8,670 neighborhoods designated as OZs, 4,089 are in urban areas (in metro areas as designated by CBSA boundaries). There are many more of these urban OZs than there are gentrifying neighborhoods. However, the overlap of gentrifying areas with OZs is high. Almost 69% of the neighborhoods identified as gentrifying in the 2013-2017 data were either within or adjacent to an OZ. The vast majority of OZs (98%) were census tracts that are “low-income communities” with high rates of poverty, though a small number (2%) of non-low-income contiguous census tracts were also designated.10 Our analysis indicates that 88.93% of the OZs are in low- to moderate- income areas as designated under the Community Reinvestment Act of 1977 (CRA). Most of the OZs that were not in actual low- to moderate- income areas are adjacent to them.

Gentrification within metropolitan areas
Metro areas with the largest population size lead the U.S. in the number of neighborhoods with indications of gentrification during the period. New York, Los Angeles and Chicago are first, second and fifth respectively. In fact, half of the top ten gentrifying cities have populations over five million, the smallest being Indianapolis with two million residents. Gentrification is usually associated with population size and growth of U.S. cities, and a variety of economic and cultural factors “pull” people to cities where it is most intense. Some of these factors involve strong correlations for gentrification with wage and income growth, expansion of technology based industries, transit access and use. 11
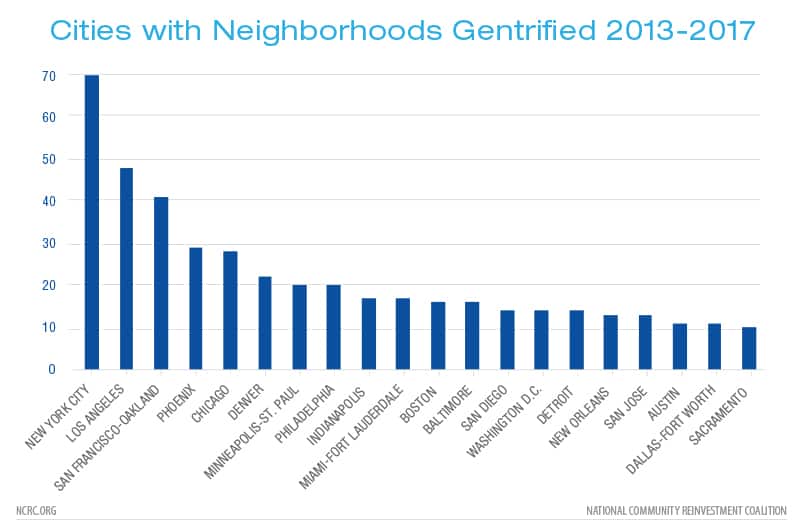
Our report covering gentrification from 2000 to 2012 indicated that Washington, D.C., had the greatest intensity of gentrification, nationally. Since 2013, San Francisco-Oakland shows indications of the highest intensity, closely followed by Denver, then Boston and Miami (Table 5). All of these cities experienced 20% or more of the neighborhoods that were eligible, undergoing gentrification during the most recent period. New Orleans is also high on the list for intensity of gentrification, an indication of the rapid development of neighborhoods affected by Hurricane Katrina during the past decade.12 Washington, D.C., still has a high intensity of gentrification, with a total of 14 (16%) of eligible neighborhoods gentrifying over the past five years, though the pace of gentrification seems to have slackened.
Neighborhood level differences
Descriptives
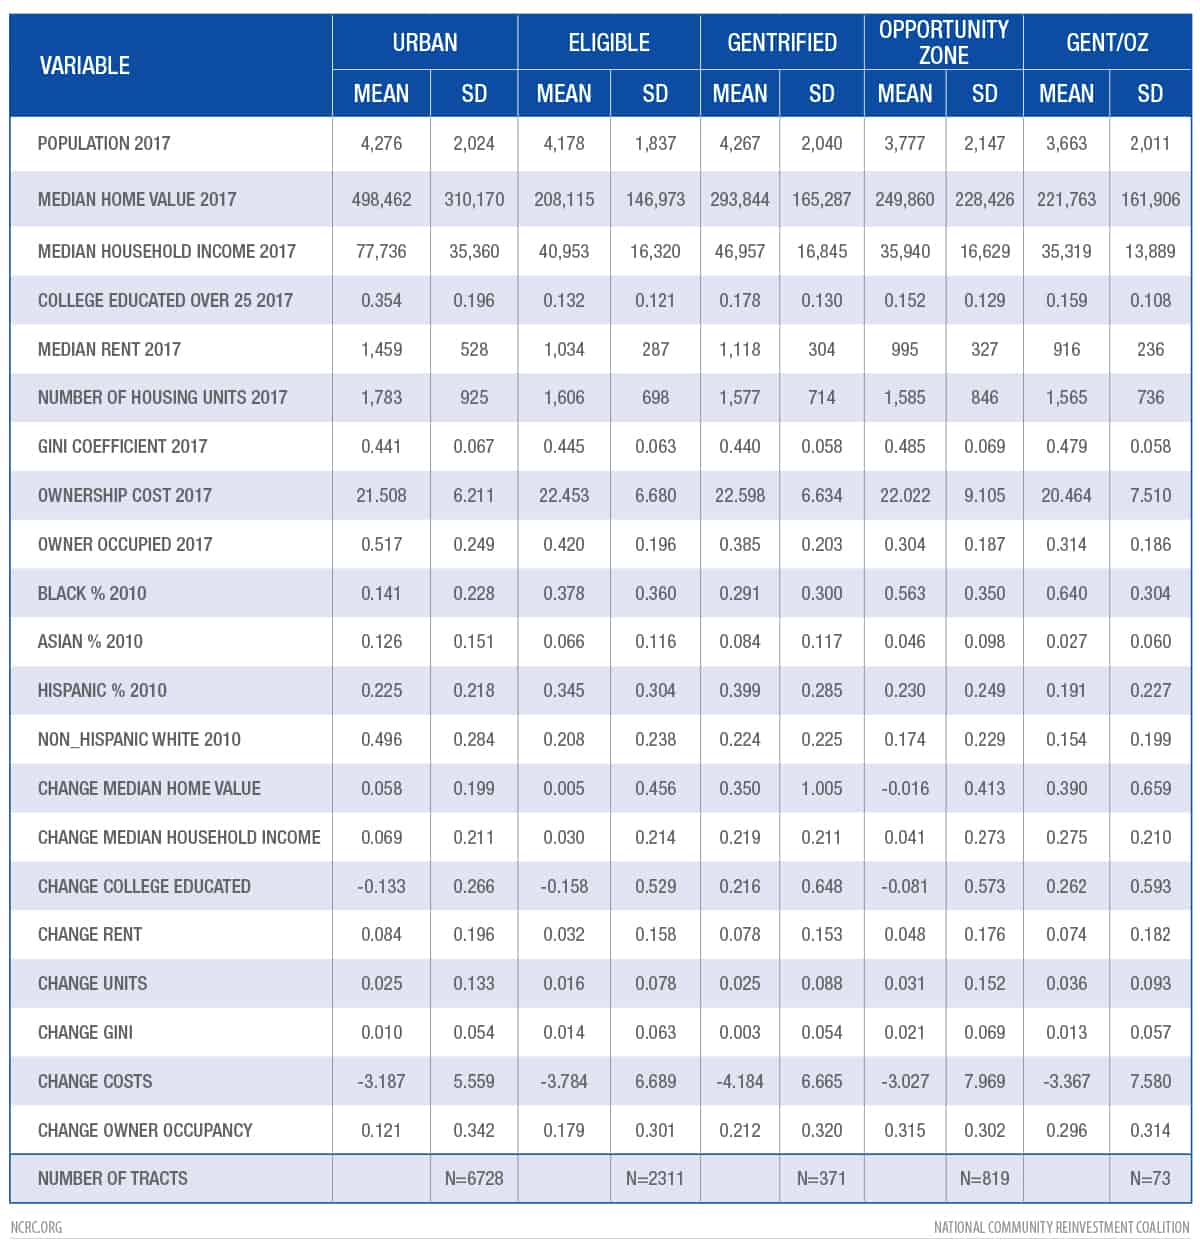
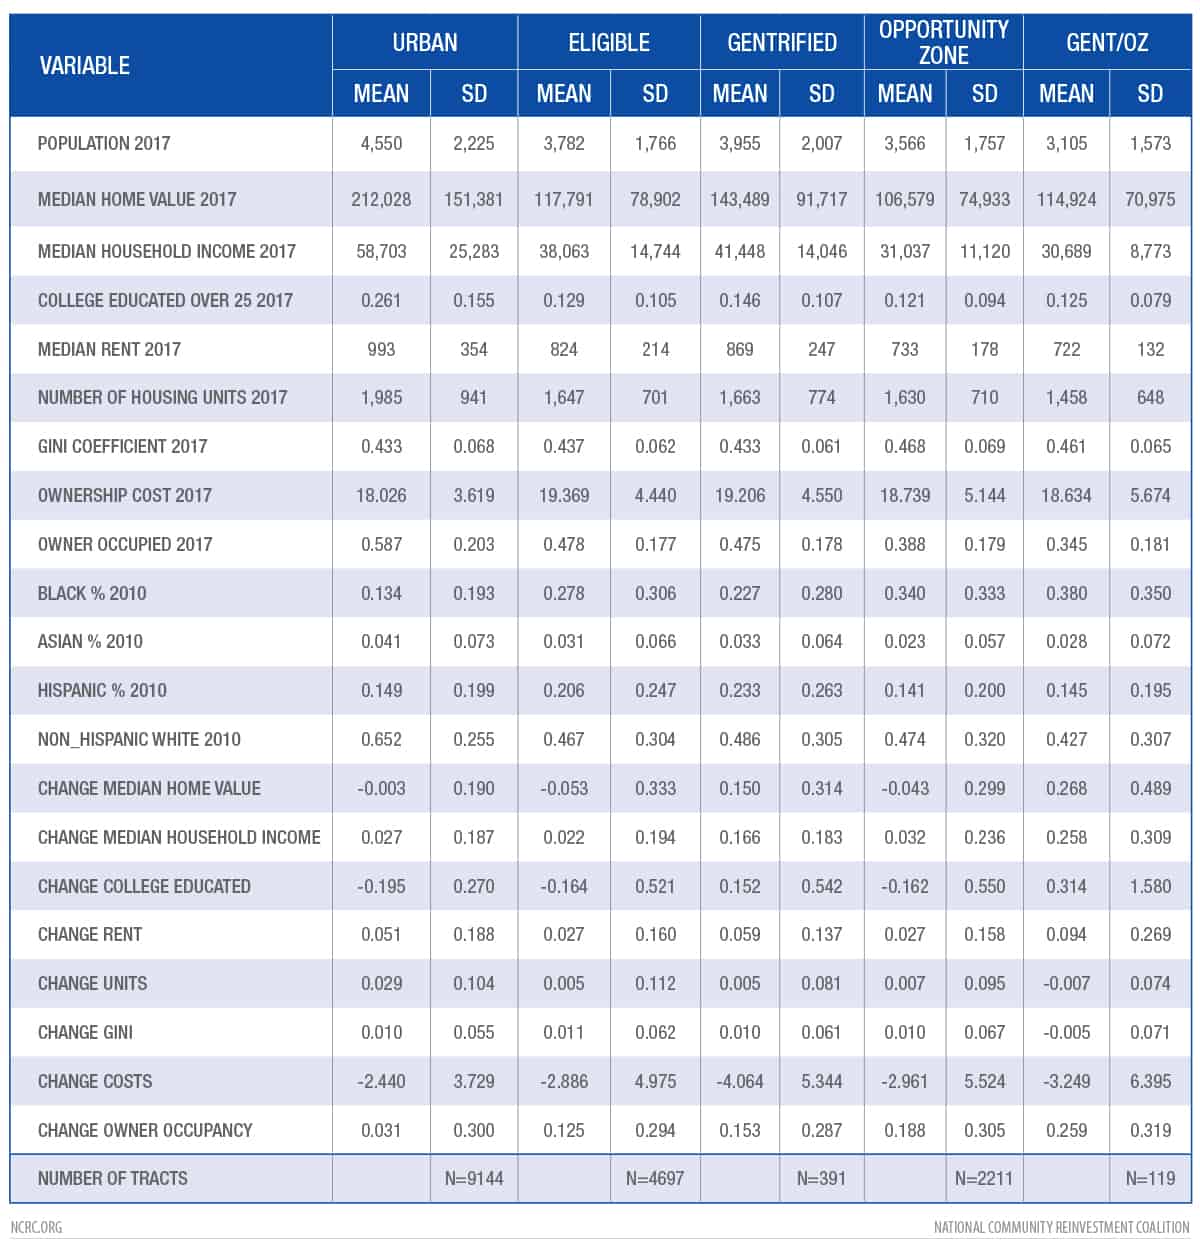
We analyzed differences between neighborhoods eligible for gentrification, designated OZs, gentrifying neighborhoods and all other urban neighborhoods of the 286 metro areas with indications of gentrification. Measurement of the average, or mean values, for a broad range of factors was undertaken. This descriptive analysis reveals several differences of resident’s economic status in four neighborhood categories (Table 6).
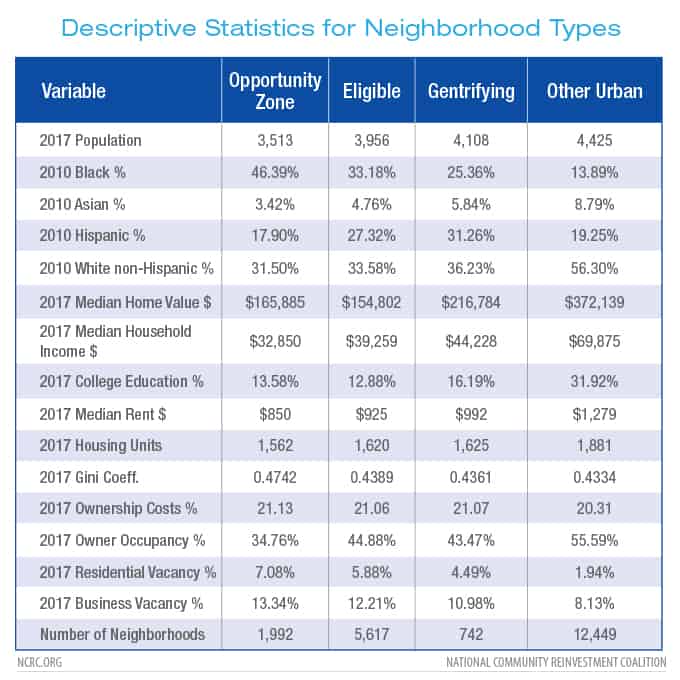
“Other urban” neighborhoods refers to areas that are within central cities, but met neither the classifications for gentrification eligibility or the OZ designation. These neighborhoods have higher indicators of socioeconomic status and most qualify as middle- to upper-income areas. They have the highest average population, median home value, median household income and percentage of college graduates. They are also the most expensive in terms of median rent costs and have the lowest residential and business vacancy levels. Demographically, the urban neighborhoods had the highest percentage of Asian and non-Hispanic White, and lowest percentage of Black residents, in 2010. In contrast, neighborhoods designated as OZs have the lowest median household income, and the second lowest percentage of college graduates and median home values. By those measures, the OZs are slightly higher than neighborhoods that were “eligible” for gentrification at the beginning of the period in 2012, but did not gentrify. The eligible neighborhoods were in the lowest 40th percentile of median household income and home value for the area in 2008-2012, and did not substantially improve during the 2013-2017 time frame of the Census ACS data. Economic inequality as measured by the Gini coefficient was greatest in OZs. Rents in OZs were 14.3% and 33.5% less than in gentrifying or other urban neighborhoods, respectively. The average population of OZs are the lowest, and they also had the lowest levels of owner-occupancy and highest residential and business vacancies, which may indicate greater degrees of abandonment. Demographically, OZs had the highest percentage of Black, and lowest percentage of non-Hispanic White, residents. Neighborhoods that were eligible to gentrify had marginally better economic conditions in terms of median home values and household income than OZs, but had lower percentages of college educated residents. Their home owner occupancy and vacancy rates were close to those of the OZs, again indicative of abandonment. Finally, gentrifying neighborhoods were sandwiched between OZs and other urban neighborhoods in terms of their economic conditions. Gentrifying areas had the second highest population average, median home value, household income and the percent of college educated residents. Values in gentrifying neighborhoods were all significantly higher than OZs, but lower than other urban neighborhoods. Median rents were also between the other two categories, however, the ownership costs were on par with eligible and gentrifying neighborhoods. Additionally, gentrifying neighborhoods had the largest increases in median home values, household income, education levels, cost of rent and decreases in owner occupancy. Gentrifying areas show improvements in the socioeconomic status of residents from eligible neighborhoods, but they are also places where rent costs more. This indicates general reduction in affordability, however, home ownership costs declined across all central city neighborhoods in the 2013-2017 period from those in the prior 2008-2012 period. This could be due to the effects of the foreclosure crisis, when many properties were “underwater” and mortgages often exceeded the value of the houses, and household income decreased due to the recession.
Opportunity Zones and Gentrifying Areas Compared
OZs cover a wide geographic area, encompassing rural and urban areas. Our analysis is restricted to OZs in the urban neighborhoods within central city areas. In these neighborhoods, there is considerable overlap with and adjacency to the neighborhoods which have indications of gentrification. So how do changes in socioeconomic conditions in gentrifying neighborhoods and OZs compare? Gentrifying neighborhoods showed significant increases in median home value, median household income, percentage of college educated residents, but also in economic inequality as measured by the Gini coefficient (Table 7). By these measures, it is clear that gentrifying neighborhoods are undergoing rapid change, with improving economic conditions.
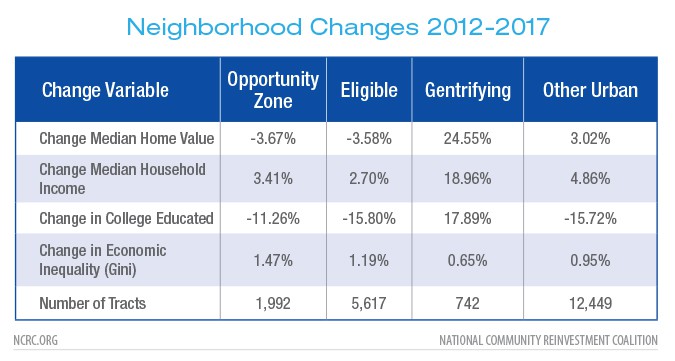
Next, if we examine the OZs, we find that they have very different economic conditions from those in gentrifying areas. OZs saw deteriorating median home values and a decrease in college-educated residents. They also saw a widening of the gap in economic inequality that was even greater than it was in those neighborhoods that were eligible but did not gentrify. In fact, the economic conditions in OZs most closely mirror those of neighborhoods that were eligible for gentrification but did not gentrify. Remember, that the eligible neighborhoods were in the bottom 40th percentile in measures of median home value and median household income. This analysis shows that on average, median home value deteriorated even further, though household incomes rose.
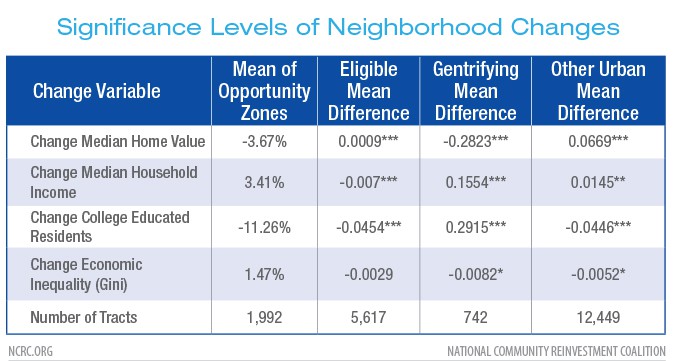
While the analysis seems to indicate that, on average, the socioeconomic conditions in OZs were marginally better than in the eligible to gentrify neighborhoods and that the conditions in OZs deteriorated, were these changes statistically significant? We used an Analysis of Variance (ANOVA) along with a common test of statistical significance, Tukey’s test for Honestly Significant Differences (HSD), to check this by examining the changes between OZs and all of the other neighborhood types. The results shown in Table 8 indicate that there were highly significant differences between the changes in median home value, median household income and percentage of college educated residents in the OZs from all other neighborhood categories. However, the differences in the increase in economic inequality (Gini coefficient) in OZs were significant from those in urban and gentrifying areas, but not from the eligible to gentrify neighborhoods.
The analysis indicated that neighborhoods that were designated as OZs and also those that were eligible for gentrification but did not gentrify were at the bottom in terms of home value, income and educational attainment of their residents. While OZs had slightly higher median home value in the most intensely gentrifying metros, they were worse-off by all of the other socioeconomic measures than the eligible neighborhoods that did not gentrify, and much worse than gentrifying neighborhoods.
Demographics
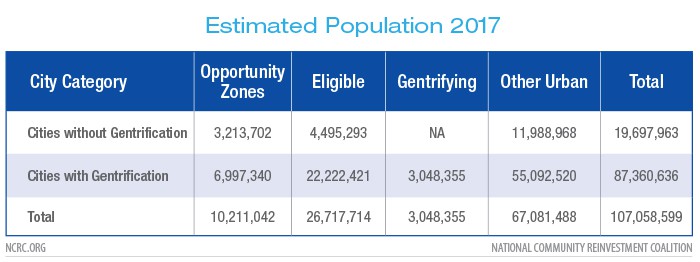
While nearly 86% of the U.S. population of 325 million13lived in urban areas in 2017, about one-third were residents of most densely urbanized central city areas. In the previous section, it was seen that the number of urban areas experiencing some gentrification was small, however, the actual number of people living in these metros was four times greater than the number who were living in cities without any gentrification (Table 9). Over 3 million people, or nearly 1% of the population, live in neighborhoods with indications of gentrification. While intense gentrification may be relatively rare across the U.S., it is most concentrated in the populous cities of the coastal regions, and a considerable number of people live in the neighborhoods most impacted by it.
Looking back to 2010 at the demographic composition of the city neighborhoods, the cities that experienced some gentrification were much more diverse in their racial and ethnic composition than those cities without any gentrification. Gentrifying neighborhoods had a low average percentage of White non-Hispanic residents in 2010, only 37% (Figure 5g). The racial and ethnic composition of the eligible, other urban and OZ designated neighborhoods were also considerably more diverse in 2010 than neighborhoods in metro areas without any gentrification (Figures 5a-5f).
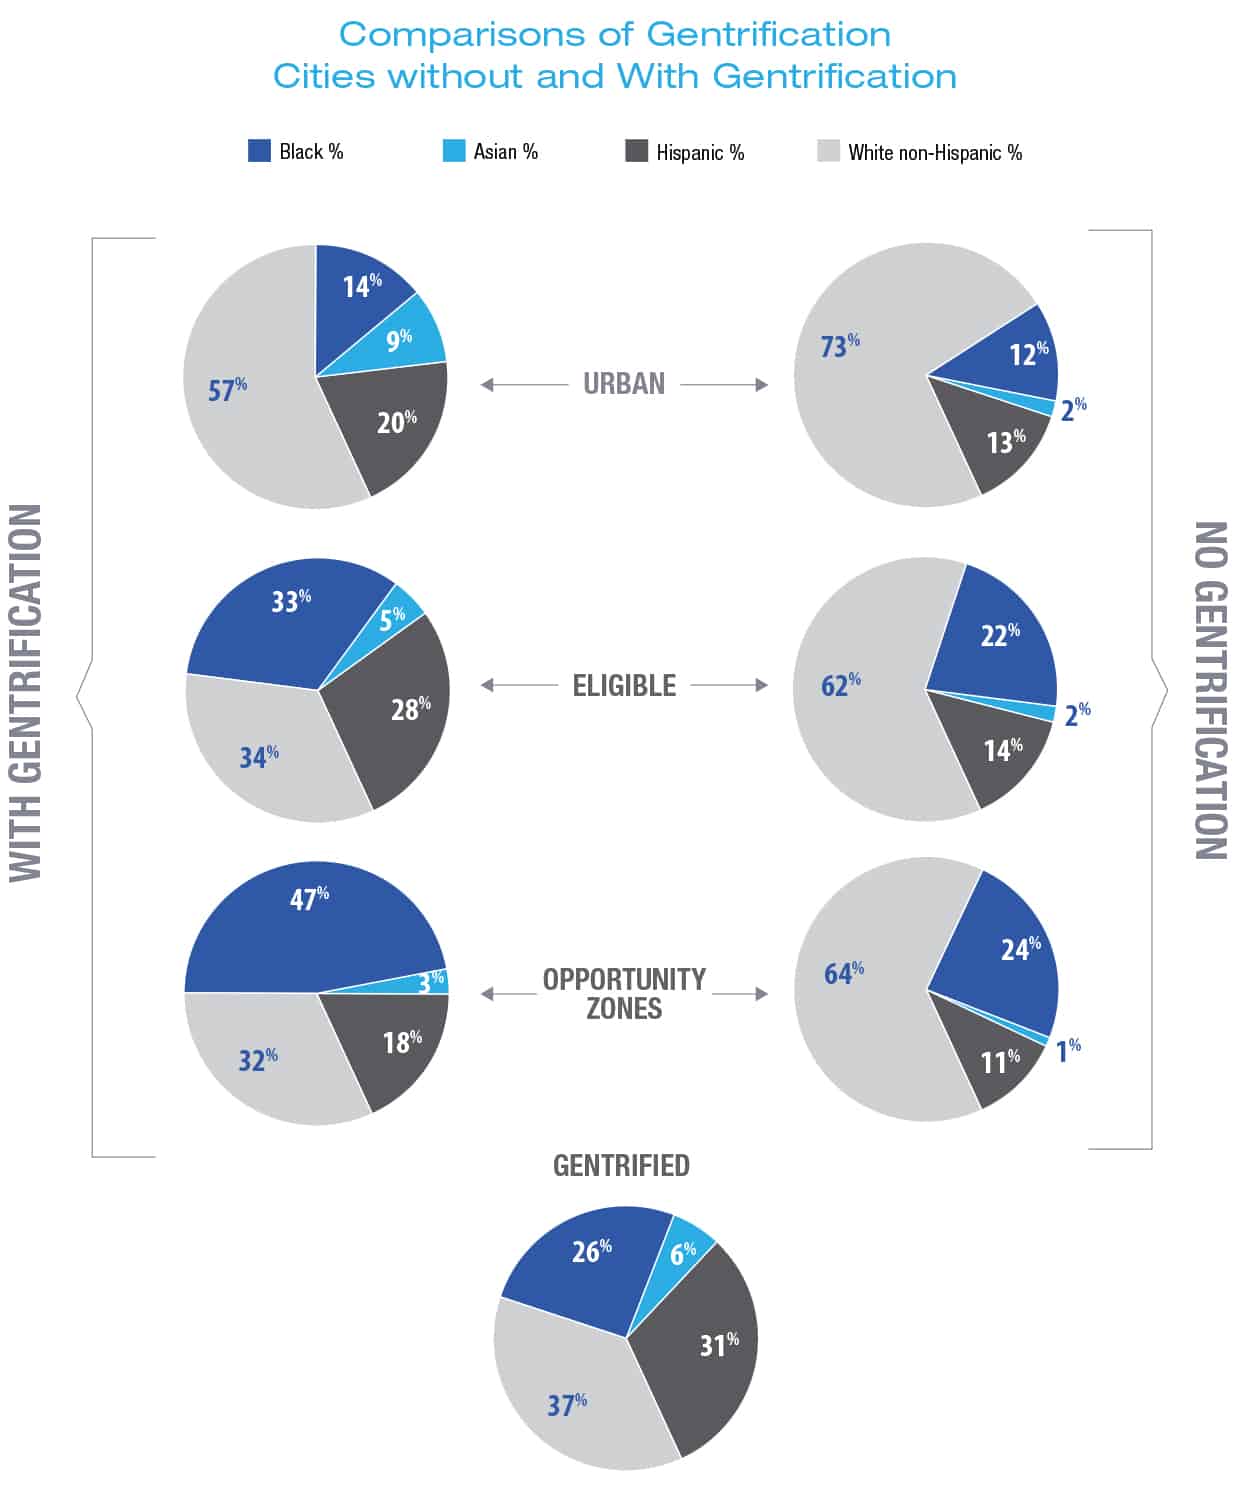
Overall, this indicated that cities experiencing intense gentrification were both larger and had greater racial diversity than other cities. The impact of gentrification was considerable for Black and Hispanic residents who were a majority of the population in 2010 of neighborhoods which later gentrified. This concentration of intense gentrification in major urban areas with diverse neighborhoods disproportionately affected minority communities, a finding of our earlier report on gentrification and displacement in the period 2000-2012.14
Affordability and Homeownership
A lack of affordable housing may impinge homeownership in the largest and most economically dynamic U.S. cities. One of the effects of the 2008 mortgage crisis and subsequent recession was a deeper decline in home values than any since the Great Depression in the 1930’s, with a slow rebound in residential construction.15 This reduced the volume of housing stock, and by 2018, when normal rates of household growth returned, the national vacancy rate reached its lowest level since 1994.16 Despite these indicators of renewed demand, housing production has lagged, placing pressure on house prices and rents and decreasing the availability of affordable housing. A survey by the National Association of Home Builders in September 2019 reported that 4 in 5 respondents believe that the lack of affordable housing has reached crisis levels.17
Gentrification is sometimes cited as a factor in decreased housing affordability because it reduces the supply of lower-cost rental units.18 leading to displacement of low-income and minority residents, which was addressed in our prior study covering the 2000-2012 time period19 Our present study addressed more recent changes in factors related to housing affordability and homeownership by examining median rent, the number of residential units, levels of residential and business vacancy, owner costs and home owner occupancy. Table 10 indicates the percent change in these variables using the ACS 5-year data covering changes from 2008-2012 and 2013-2017. Median rent increased fastest in middle- to upper-income other urban and in gentrifying neighborhoods. Additionally, the gentrifying and other urban neighborhoods had lower levels of residential and business vacancy than the other neighborhood categories, however, the number of residential units increased the most in other urban and OZs, with gentrifying neighborhoods having a slightly lower increase in units. It may seem peculiar that owner costs declined across all neighborhood categories, however, this variable takes into account changes in household income during a long period. Therefore, this may be an artifact of use of the ACS 5-year dataset, the earlier one of which had a midpoint of 2010, covering the period of the mortgage foreclosure crisis during which a quarter of homeowners in certain markets held mortgages that were over-leveraged and “underwater” relative to their home value.20 The high levels of mortgage insolvency and over-leveraging, combined with declines in income during the recession created an intense financial downturn which would impact homeownership costs. The subsequent 2013-2017 ACS dataset covered a period of financial expansion, with lower mortgage rates, and marginally increasing incomes which would have impacted ownership costs. Overall, median rent in gentrifying neighborhoods was second highest in cost and increased almost as much as that in the other urban neighborhoods. These increases in rental costs and low vacancy levels seem to indicate declining affordability, though the decrease in ownership costs could have acted as a mitigating factor in gentrifying neighborhoods,
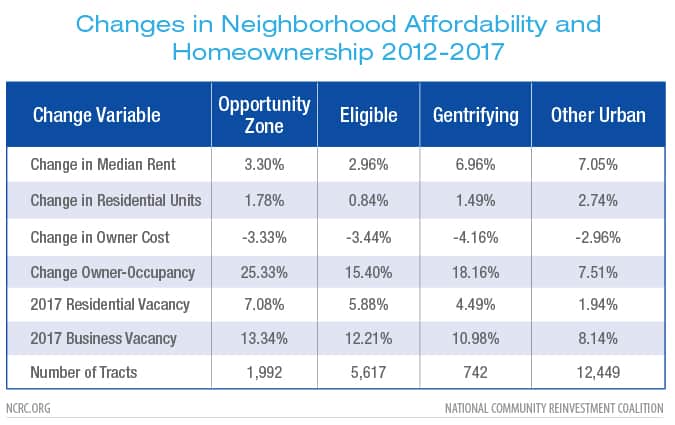
Homeownership levels, as measured by owner occupancy, appeared to increase across every neighborhood category in cities with indications of gentrification. While middle- to upper-income other urban neighborhoods had the highest levels of owner occupancy, OZs and gentrifying neighborhoods experienced the strongest increase during the study period. Despite this, the OZs had the lowest overall level of owner occupancy, and barely a third of the residents of these neighborhoods were homeowners. They also had the highest vacancy levels, and the lowest average number of housing units. OZs and neighborhoods eligible for gentrification had indications of being the most affordable, but also had the lowest levels of homeownership in cities with indications of gentrification.
CONCLUSION
This study examined differences in socioeconomic and demographic factors for OZs and those areas that were not designated as OZs. There were clear differences not just between OZs and other neighborhoods but between OZs in cities where there were indications of gentrification and other metro areas where there was no gentrification. Taken as a whole, OZs tended to be neighborhoods with lower incomes and home values as well as fewer residents with a college education, regardless of whether or not they were gentrifying. Income inequality in OZs was also higher than in other neighborhoods. There were also sharp differences in the demographics of neighborhoods in cities which had some indications of gentrification and those that did not, with much higher percentages of minority residents across all neighborhood classifications; eligible, gentrified, other urban and OZ. In the cities with indications of gentrification, the differences between OZs and other neighborhoods were amplified, with OZs having the highest percentages of minority residents. In cities without indications of gentrification, the population of OZs in 2010 was 36% people of color, while in the cities with gentrification that figure rose to 68%. Black residents make up the majority of the people of color in these communities, just as they tend to make up a larger percentage of residents in distressed neighborhoods that were eligible but did not gentrify.
Neighborhoods designated as OZs far outnumbered those neighborhoods where the study found gentrification. This was due to the design of the Opportunity Zone program, which allows states to designate up to 25% of their low-income neighborhoods as OZs as long as they meet the program criteria. Those designations are not limited by central city location or other population measures that were used to determine gentrification eligibility. However, among those neighborhoods where this study identified gentrification, 69% of the time they were either an OZ or they were adjacent to one.21 This high degree of overlap, and the intensive concentration of Black households validated concern that OZ’s may trigger displacement in gentrifying neighborhoods.
The findings of this study suggest that concern about the impact of OZs is warranted, but that the designation of an area as an OZ, especially in the majority of cities where gentrification is not widespread, is an indicator of a neighborhood with the greatest distress and income inequality. In fact, nearly 84% of the urban OZs overlap CRA designated low- to moderate-income neighborhoods. A study focus for OZs should be placed on the types and quality of investments attracted to them, and whether these investments contribute to the economic well-being of low-income residents in which the investment is made. Future areas of research on OZs could include an assessment of the overall level and form that investment takes in these areas and how it differs from other neighborhoods. Also, the impact on the residents, particularly low- to moderate income and minority families, is a concern. The current lack of data on Opportunity Fund investments presents a major barrier to future research. This makes it difficult to quantify whether the economic impact of OZs results in economic revitalization, or gentrification and displacement.
APPENDIX
Gentrification and Opportunity Zones in the Top Five Cities for Intensity
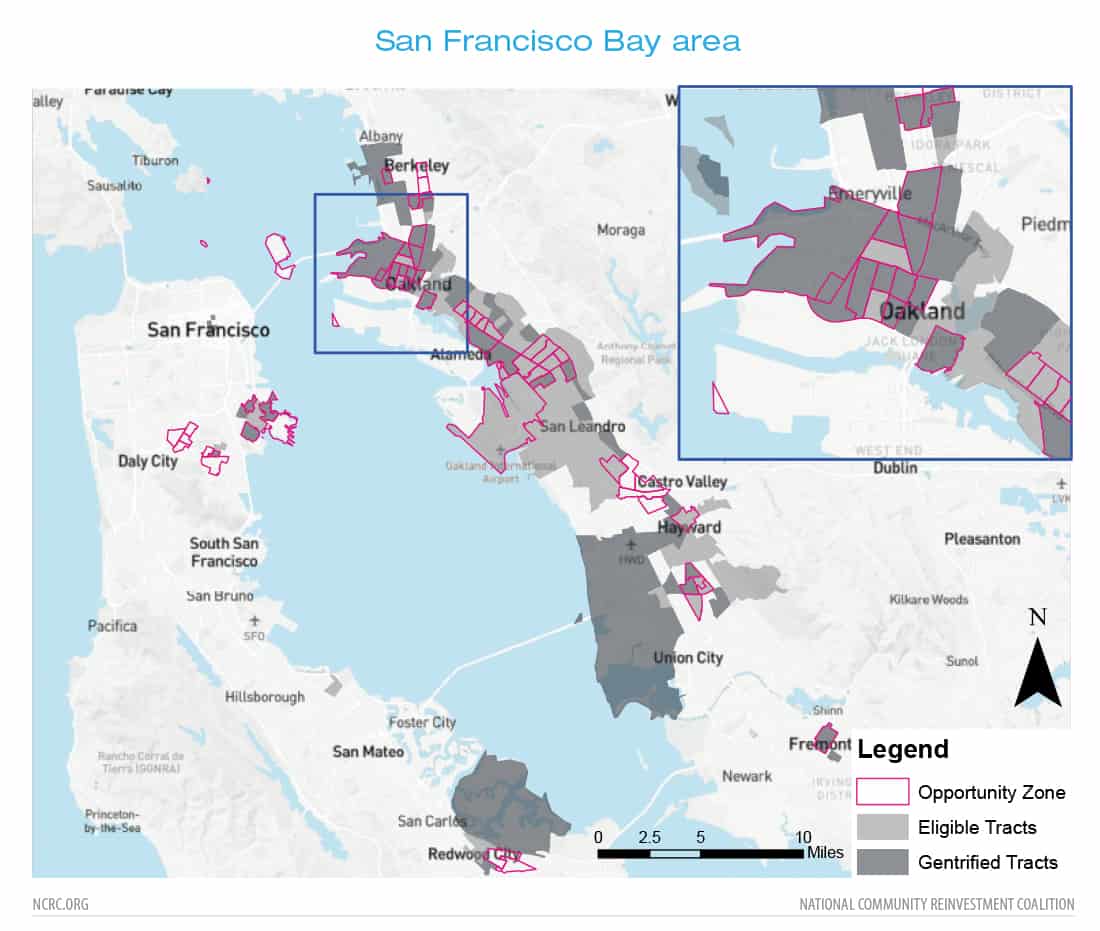 A-1 San Francisco Bay metro area
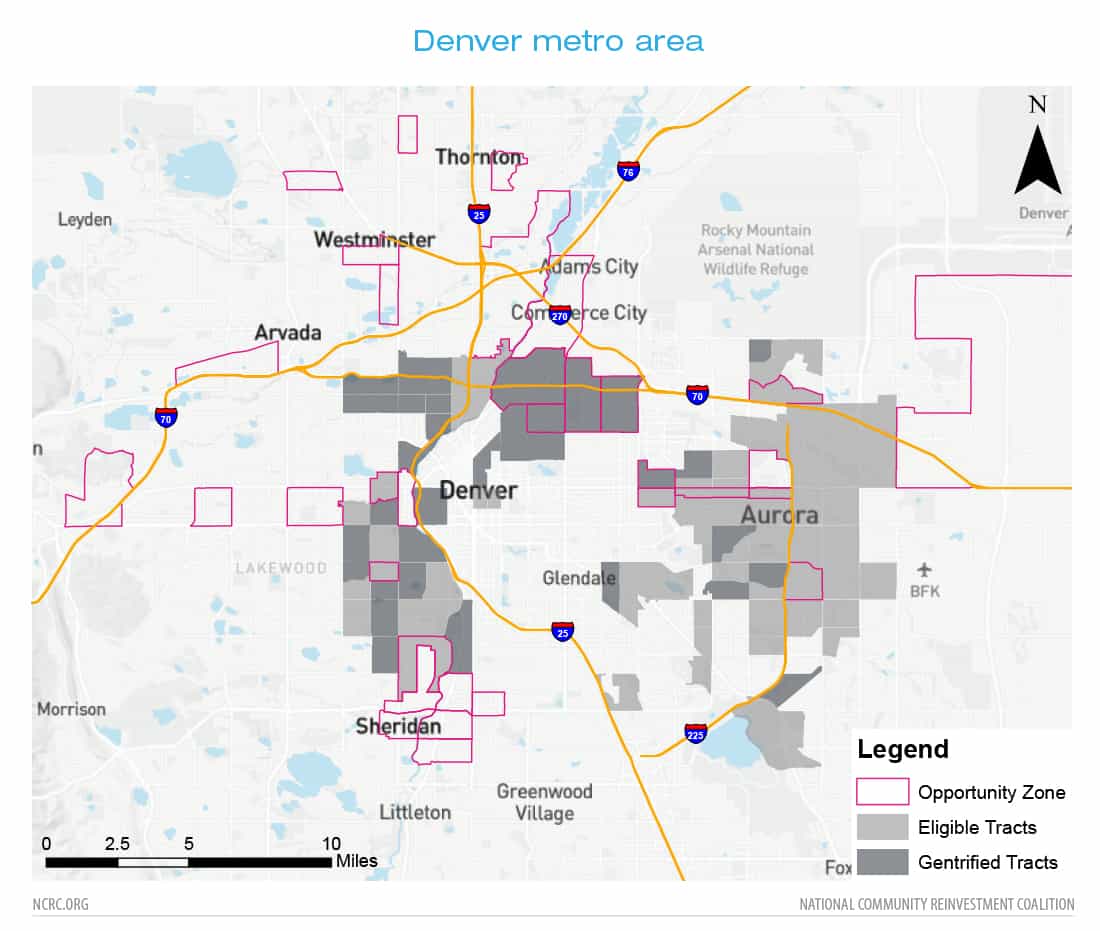 A-2 Denver metro area
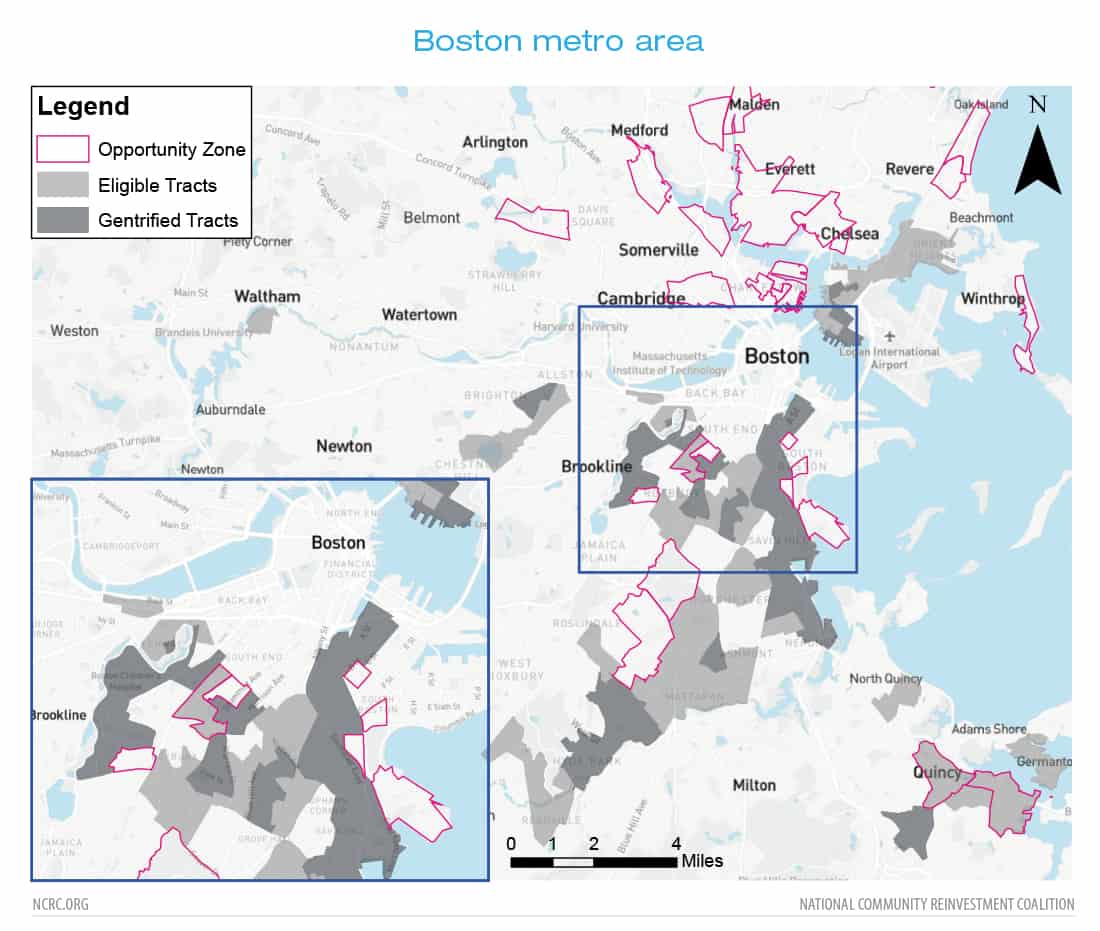 A-3 Boston metro area
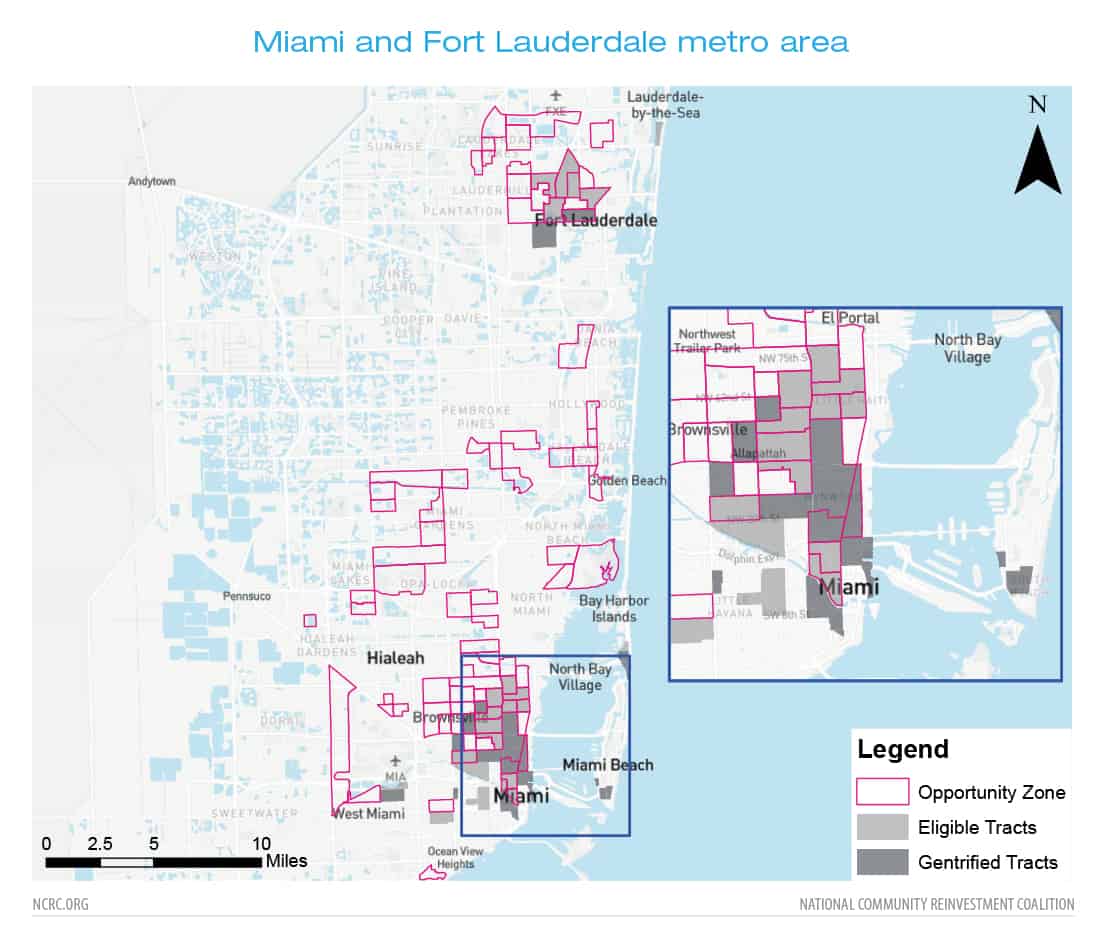 A-4 Miami and Fort Lauderdale metro area
A-5 New Orleans metro area
Cover photo: Guus Baggermans on Unsplash

- https://www.irs.gov/newsroom/opportunity-zones-frequently-asked-questions
- https://kinder.rice.edu/urbanedge/2019/02/20/opportunity-zones-gentrification-steroids
- https://itep.org/how-opportunity-zones-benefit-investors-and-promote-displacement/
- https://www.enterprisecommunity.org/download?fid=11643&nid=8725
- https://talkpoverty.org/2018/12/13/tax-break-low-income-opportunity-rich
- As of 2017, the U.S. Census Bureau estimated that 85.87 percent of U.S. residents live in an MSA. https://factfinder.census.gov/faces/tableservices/jsf/pages/productview.xhtml?src=bkmk
- https://www.brookings.edu/blog/the-avenue/2018/01/22/uneven-growth/
- https://ncrc.org/gentrification/
- https://www.ffiec.gov/hmda/doc/census03.doc
- This is based on the list of designated Opportunity Zones issued on 12/14/2018 in which 198 of the 8,764 OZs listed are considered Non-LIC contiguous. https://www.cdfifund.gov/Pages/Opportunity-Zones.aspx
- Florida, R. (2017). The new urban crisis: How our cities are increasing inequality, deepening segregation, and failing the middle class-and what we can do about it. Basic Books. Pg 223
- https://www.citylab.com/environment/2019/02/gentrification-causes-new-orleans-natural-disasters-hurricane-katrina/582499/
- https://www.census.gov/newsroom/press-releases/2017/estimates-idaho.html
- https://ncrc.org/gentrification/
- https://www.jchs.harvard.edu/sites/default/files/Harvard_JCHS_State_of_the_Nations_Housing_2019.pdf
- https://fred.stlouisfed.org/series/USHVAC
- https://www.nahb.org/news-and-publications/press-releases/2019/09/vast-majority-of-americans-cite-growing-housing-affordability-problem-as-a-crisis.aspx
- Immergluck, D., Carpenter, A., & Lueders, A. (2018). Hot city, cool city: explaining neighbourhood-level losses in low-cost rental housing in southern US cities. International Journal of Housing Policy, 18(3), 454-478.
- https://ncrc.org/gentrification/
- https://www.frbsf.org/economic-research/publications/economic-letter/2010/october/underwater-mortgages/
http://haasinstitute.berkeley.edu/sites/default/files/haasinsitute_underwateramerica_publish_0.pdf
- 657 of the 954 neighborhoods which have indications of gentrifiation during the 2013-2017 study period are within, or adjacent to a designated Opportunity Zone.