Introduction
Asian Americans are the fastest growing racial group in the United States, and are predicted to be the nation’s largest immigrant group in 50 years.[1] Asian American is a racial category that includes Americans who are from or whose relatives are from a diverse group of countries: China, Korea, Japan, India, Pakistan, Thailand, Vietnam, the Philippines and many others. According to a 2017 report by Pew, the population of immigrant Asian Americans is expected to make up 38% of all U.S. immigrants, surpassing Hispanics in 2055.[2]
Demographics
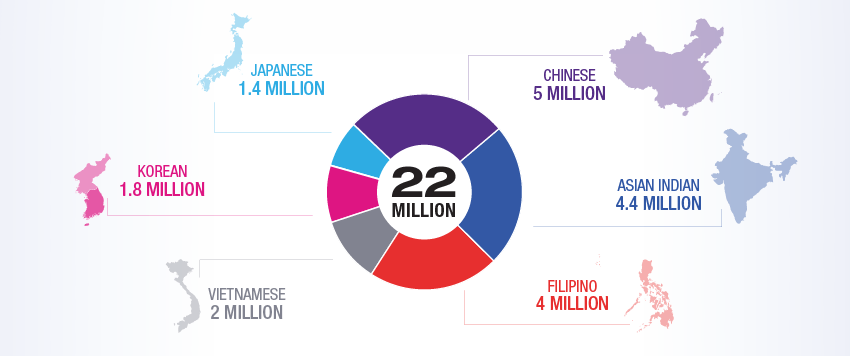
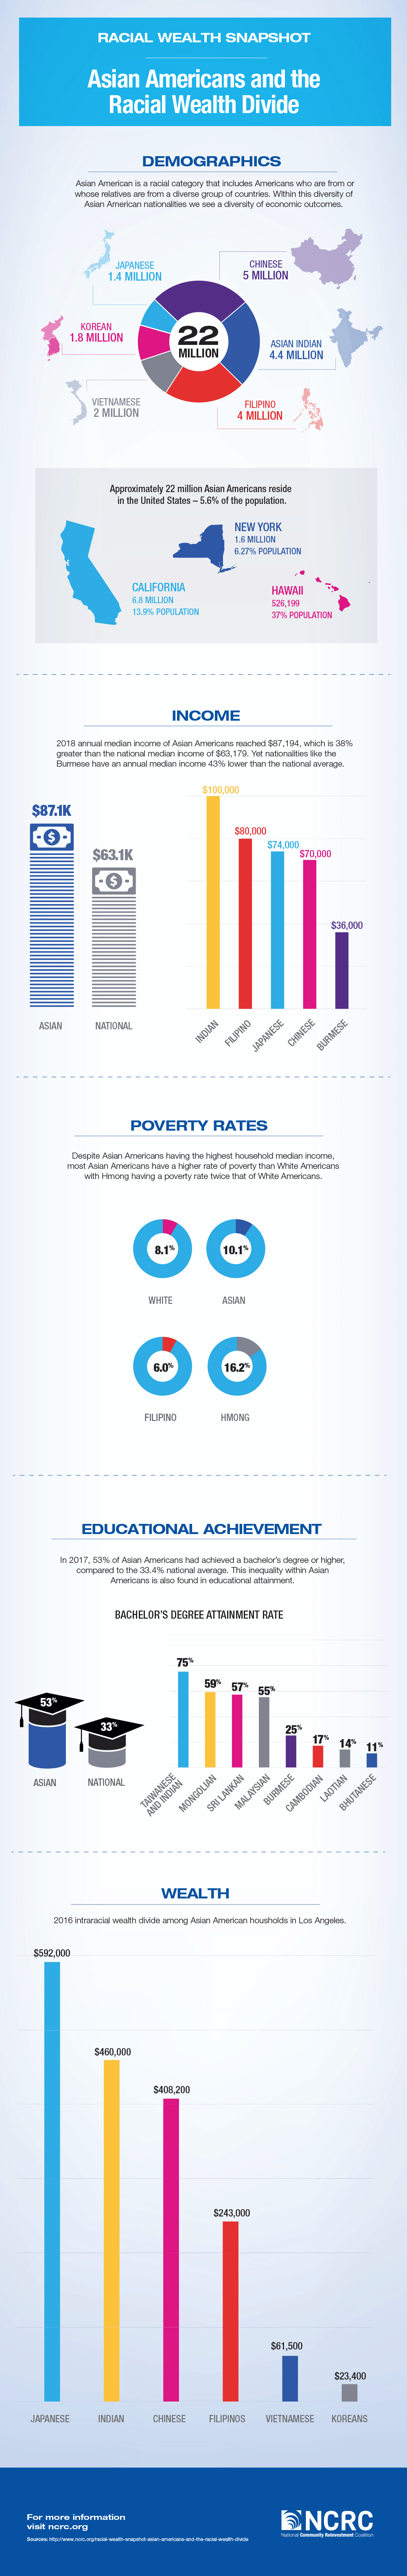
Asian Americans consist of a multitude of immigrants and descendants from countries in Southeast, South, East and Central Asia. Among all the Asian Americans in the U.S., nearly 6 in 10 were foreign born in 2015, thus making the majority of Asian Americans immigrants.[3] In 2017, the Asian American population was estimated to be approximately 22 million, 5.6% of the total U.S. population. Chinese Americans are the largest Asian American nationality with a population of 5 million, followed by Asian Indian (4.4 million), Filipino (4 million), Vietnamese (2 million), Korean (1.8 million) and Japanese (1.4 million).[4] The Asian American population is expected to reach 14% of the total U.S. population by 2065.
The Asian American population is highly urbanized, mostly residing in cities in California and New York, such as Los Angeles, San Francisco and New York City.[5] California has the highest Asian American population, with a total of 6.8 million Asian Americans, counting for 13.9% of California’s total population. Similarly, New York has a high Asian American population, approximately 1.6 million. Hawaii has the highest relative population of Asian Americans, where the Asian American population comprises 37% (526,199) of the island’s total population. Although traditionally Asian Americans have resided in the Northeast and West regions of the U.S., recent migration studies show that Asian Americans are expanding their footprint by moving to the Midwest and South.[6]
Income
The household median income for Asian Americans increased by 4.6% from 2017 to $87,194 in 2018, 38% greater than the national median income of $63,179.[7] Indian Americans have the highest income among Asian American subgroups, with a median income of $100,000. Following Indian Americans is Filipino with a median income of $80,000, and thereafter Japanese and Chinese, respectively with $74,000 and $70,000. A report from Pew Research Center shows that income inequality in the U.S. is rising most rapidly among Asian Americans, as Burmese Americans make a median income of $36,000.[8]
However, income is highly dependent on a myriad of factors, education being one of the most important. When educational attainment is factored in, Asian Americans with less than a high school education make approximately $25,000 annually, compared to White Americans who make $29,100. Additionally, Asian Americans with high school completion make $29,100 compared to White Americans who make $35,000. However, at an associate degree level, Asian Americans and White Americans incomes even out at approximately $39,700. Asian Americans with a bachelor’s or master’s degree earn $59,700 and $80,500, respectively, while White Americans earn $50,000 and $61,000.[9] Differences in degrees may account for these disparities, as Asian Americans tend to obtain higher-paying degrees, such as business, biological and biomedical sciences, and health professions more than any other race.[10]
Another factor to understand Asian American income is household size. In 2017, Asian Americans on average had a household size of 3.04, compared to the national average of 2.65. Additionally, Asian Americans disproportionately live in metropolitan areas where the cost of living is high, such as Los Angeles, San Francisco and New York City. Asian American income is better understood by factoring in additional information such as household size and cost of living, so that key insights to how that income is used can be obtained.
Poverty
Despite Asian Americans having the highest household median income, many Asian Americans still face economic insecurity. In 2018, 10.1% of Asian Americans lived in poverty, compared to 8.1% of White, non-Hispanic Americans. Additionally, not all Asian Americans equally face financial insecurity. Large discrepancies between income and wealth among Asian American nationalities lends itself to different degrees of economic inequality. According to 2017 Census data, Filipino Americans faced a 6.0% poverty rate, compared to the 16.2% for Hmong Americans.[11] Additionally, many Asian Americans are falling through the cracks in data representation and social services, making it difficult to evaluate accessible services for communities who need them.[12]
Unemployment
Asian Americans have the lowest unemployment rate across any household of color, with only 3.3% of the population unemployed in the first quarter of 2020, compared to the national average of 4.1%.[13] Such low rates of unemployment may be explained through the type of immigration seen from Asia to the U.S. For example, Asian immigrants hold the majority of employer-sponsored H-1B visas,[14][15] and in 2018, Chinese nationals received nearly half of EB-5 investor green cards, allowing permanent residency in the U.S. on the condition of an investment of $500,000 to finance a business that will employ at least 10 American workers.[16]
Education
In 2017, 53% of Asian Americans had achieved a bachelor’s degree or higher,[17] compared to the 33.4% national average. Asian American men were slightly more likely to have a bachelor’s degree than women, as 54.9% of men held a bachelor’s degree compared to women’s 51.3%. However, education attainment is not equal across all Asian Americans. Just 1 in 4 Burmese Americans have a bachelor’s degree or higher, compared to about 3 in 4 Taiwanese Americans and Indian Americans.[18] Mongolian, Sri Lankan and Malaysian Americans have bachelor’s degrees with high rates, 59%, 57% and 55%, respectively[19]. On the other end, Bhutanese, Laotian and Cambodian have the lowest rates of attaining bachelor’s degrees, at 11%, 14% and 17%. The discrepancies in levels of education among Asian Americans may account for the intragroup differences in income, employment and wealth.
Wealth
Asian Americans are the most economically divided racial group in the U.S. Although some Asian Americans have accumulated a large amount of wealth comparable to Whites, many other Asian Americans have little or no wealth. In a 2016 study using the National Asset Scorecard for Communities of Color, researchers found intraracial wealth gaps among Asian Americans in Los Angeles. The authors found that Japanese ($592,000), Asian Indian ($460,000) and Chinese ($408,200) households had higher median wealth than Whites. Conversely, Koreans ($23,400), Vietnamese ($61,500) and Filipinos ($243,000) had a substantially lower amount of wealth.[20] A nationwide 2013 report shows that the median Asian wealth was $91,440, higher than the wealth of Blacks and Latinos, but still less than White Americans median wealth of $134,008.[21] Additionally, Asian Americans at the bottom of the income distribution have less wealth than Whites similarly located.[22]
[1] López, G., Ruiz, N. G., & Patten, E. (2017, September 8). Key facts about Asian Americans.
[2] López, G., Ruiz, N. G., & Patten, E. (2017, September 8). Key facts about Asian Americans.
[3] López, G., & Radford, J. (2017, May 3). 2015, Foreign-Born Population in the United States Statistical Portrait.
[4] US Census Bureau. (2019, May 8). Asian-American and Pacific Islander Heritage Month: May 2019.
[5] Asian Population 2020. (n.d.).
[6] Asian-Americans: Culturally Diverse and Expanding Their Footprint. (2016, May 19).
[7] US Census Bureau. (2019, December 4). Income, Poverty and Health Insurance Coverage in the U.S.: 2018.
[8] Kochhar, R., & Cilluffo, A. (2019, December 31). Appendix B: Additional tables.
[9] Indicator 30: Earnings and Employment. (2019, February).
[10] Indicator 25: Undergraduate and Graduate Degree Fields. (2019, February).
[11] Office of Minority Health. (2019, August 22).
[12] Tran, V. (2018, June 19). Asian Americans are falling through the cracks in data representation and social services.
[13]E-16. Unemployment rates by age, sex, race, and Hispanic or Latino ethnicity. (2020, April 3).
[14] Krogstad, J. M., & Radford, J. (2018, September 14). Education levels of U.S. immigrants are on the rise.
[15] Echeverria-Estrada, J. B. C., & Batalova, J. (2020, February 5). Chinese Immigrants in the United States.
[16] Echeverria-Estrada, J. B. C., & Batalova, J. (2020, February 5). Chinese Immigrants in the United States.
[17]US Census Bureau. (n.d.). SELECTED POPULATION PROFILE IN THE UNITED STATES.
[18] Shah, S., & Ramakrishnan, K. (2017, April 24). Why Disaggregate? Big Differences in AAPI Education.
[19] Shah, S., & Ramakrishnan, K. (2017, April 24). Why Disaggregate? Big Differences in AAPI Education.
[20] Runes, C. (2018, May 10). What’s behind the wealth gap in Asian American and Pacific Islander communities?
[21] Boshara, R., Emmons, W. R., & Noeth, B. J. (2015). The demographics of wealth-how age, education and race separate thrivers from strugglers in today’s economy. Essay no. 1: Race, ethnicity and wealth. Demographics of Wealth, (1), 1-24.
[22] Weller, C. E., & Thompson, J. E. (2016, December 20). Wealth Inequality Among Asian Americans Greater Than Among Whites.
Sources
Asian Population 2020. (n.d.).
Asian-Americans: Culturally Diverse and Expanding Their Footprint. (2016, May 19).
E-16. Unemployment rates by age, sex, race, and Hispanic or Latino ethnicity. (2020, April 3).
Indicator 25: Undergraduate and Graduate Degree Fields. (2019, February).
Indicator 30: Earnings and Employment. (2019, February).
Kochhar, R., & Cilluffo, A. (2019, December 31). Appendix B: Additional tables.
López, G., Ruiz, N. G., & Patten, E. (2017, September 8). Key facts about Asian Americans.
Office of Minority Health. (2019, August 22).
Shah, S., & Ramakrishnan, K. (2017, April 24). Why Disaggregate? Big Differences in AAPI Education.
US Census Bureau. (n.d.). SELECTED POPULATION PROFILE IN THE UNITED STATES. Asian alone or in combination with one or more other races (400-499) & (100-299) or (300, A01-Z99) or (400-999)&tid=ACSSPP1Y2017.S0201&q=S0201
US Census Bureau. (2019, May 8). Asian-American and Pacific Islander Heritage Month: May 2019.
Wong, A. (2017, July 20). For Many Asian Students, Education is About Reputation.
