A previous NCRC analysis found that, overall, a higher percentage of banks made a higher percentage of home loans to low- and moderate-income (LMI) borrowers and communities than non-banks and credit unions. However, access to home loans is only half the battle. We also need to have information on the affordability of loans to get the complete picture of which lenders are promoting both accessibility and affordability for underserved borrowers and communities. This study finds non-bank mortgage companies are less affordable for all borrowers as they issue a higher percentage of high-cost loans than banks and credit unions. The affordability of loans to LMI and even MUI borrowers and census tracts is of keen interest to policy makers and stakeholders.
Significant home value appreciation, particularly in large coastal metropolitan areas, threaten to price out first-time homebuyers including millennials, people of color and modest income families. Which groups of lenders are striving to make homeownership affordable and sustainable and which groups of lenders could be exacerbating the affordability gap?
Summary of findings:
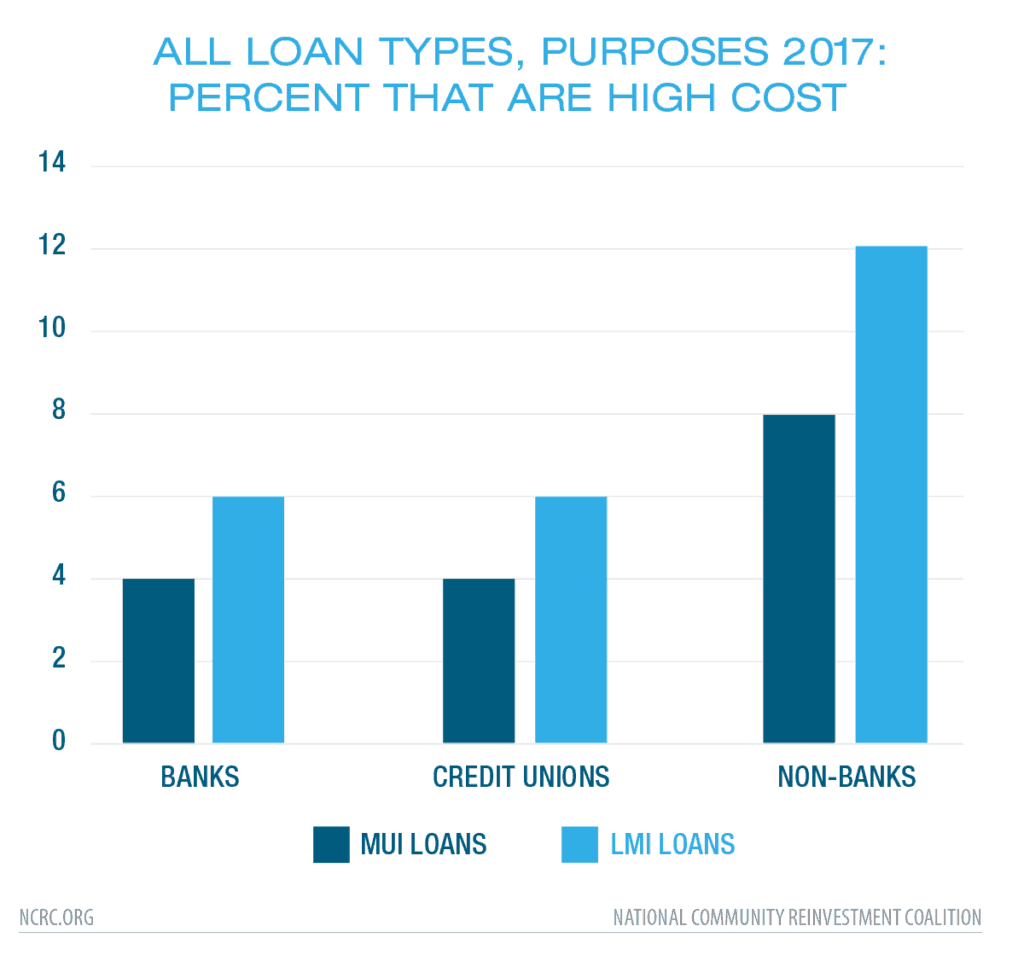
- In 2017, considering all loan types and purposes, 6% of bank and credit union LMI loans were high cost compared to 12% of non-bank loans. A similar disparity occurs for MUI loans.
- This disparity remains when considering just home purchase loans.
- The disparity among lender types disappears when considering conventional home purchase lending.
- The disparity among lender types re-appears when considering government-insured lending. For example, 23% of non-bank LMI loans were high cost compared to 10% of bank loans and 3% of credit union loans.
- Even for middle- and upper-income (MUI) government-insured loans, 19% of non-bank loans were high cost, while just 6% of bank loans and 1% of credit union loans were.
Analysis
NCRC reviewed loans made by banks, credit unions and non-banks using 2017 Home Mortgage Disclosure Act (HMDA) data reported by lenders and provided by Robert Avery, project director, National Mortgage Database Program at the Federal Housing Finance Administration (FHFA), and from the Federal Financial Institutions Examination Council (FFIEC) 2017 HMDA snapshot file downloaded from the Consumer Financial Protection Bureau (CFPB).
We identified ‘high-cost’ loans as those with a rate spread indicator, which means that when the loan closed the rate that the consumer was charged for the loan was 1.5 percentage points higher than the Average Percent Offer Rate (APOR) for that day.
Then loans were identified as having either a borrower that qualified as LMI or made to borrowers in LMI census tracts using the standard Community Reinvestment Act (CRA) definitions of these terms and according to the FFIEC 2017 census file. Loans that did not meet either of these conditions were labeled as MUI loans.
The first table and chart identifies the percent of loans that were high cost and includes all loans, regardless of loan purpose, occupancy, construction type or other variables.

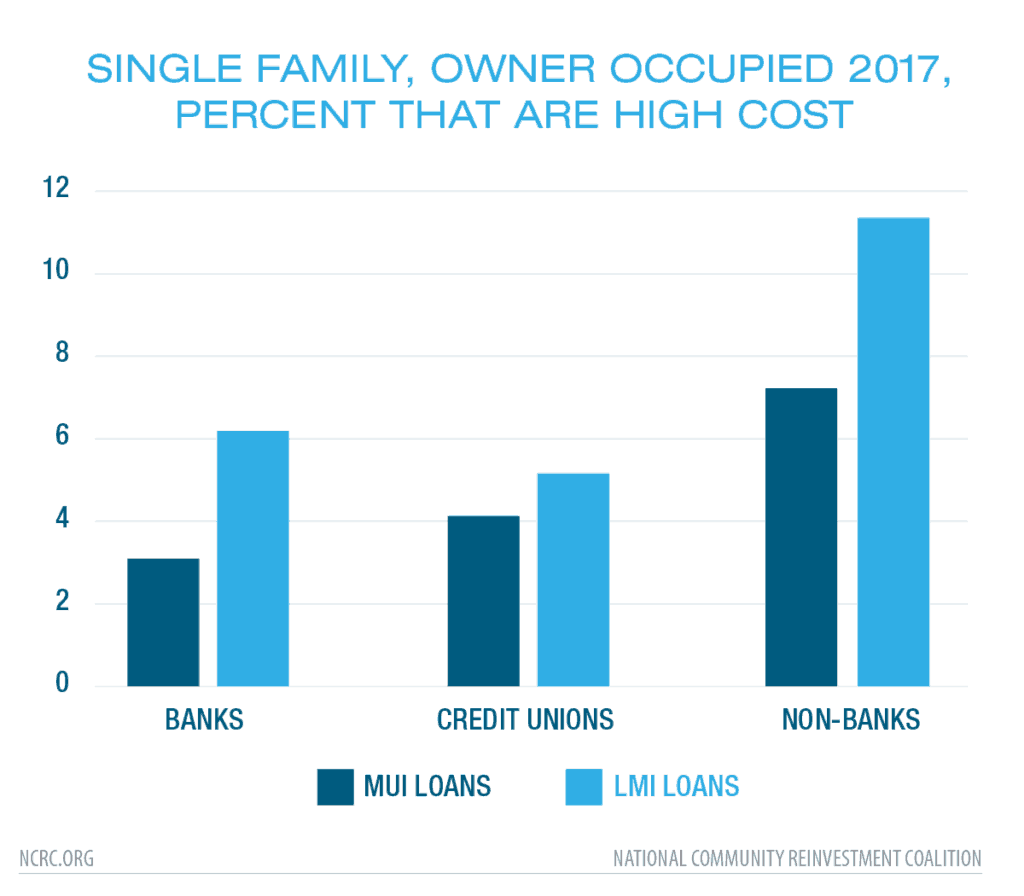
 The second table and chart covers just loans that were made on single family, owner occupied properties, including home purchase, refinance and remodel loans. We deleted manufactured home lending and loans made to investors to see if differences in the incidence of high-cost lending remain.

The third table and chart is for home purchase loans on owner-occupied, single family homes. We delete refinance and home improvement lending to see if differences in the incidence of high-cost lending remain.

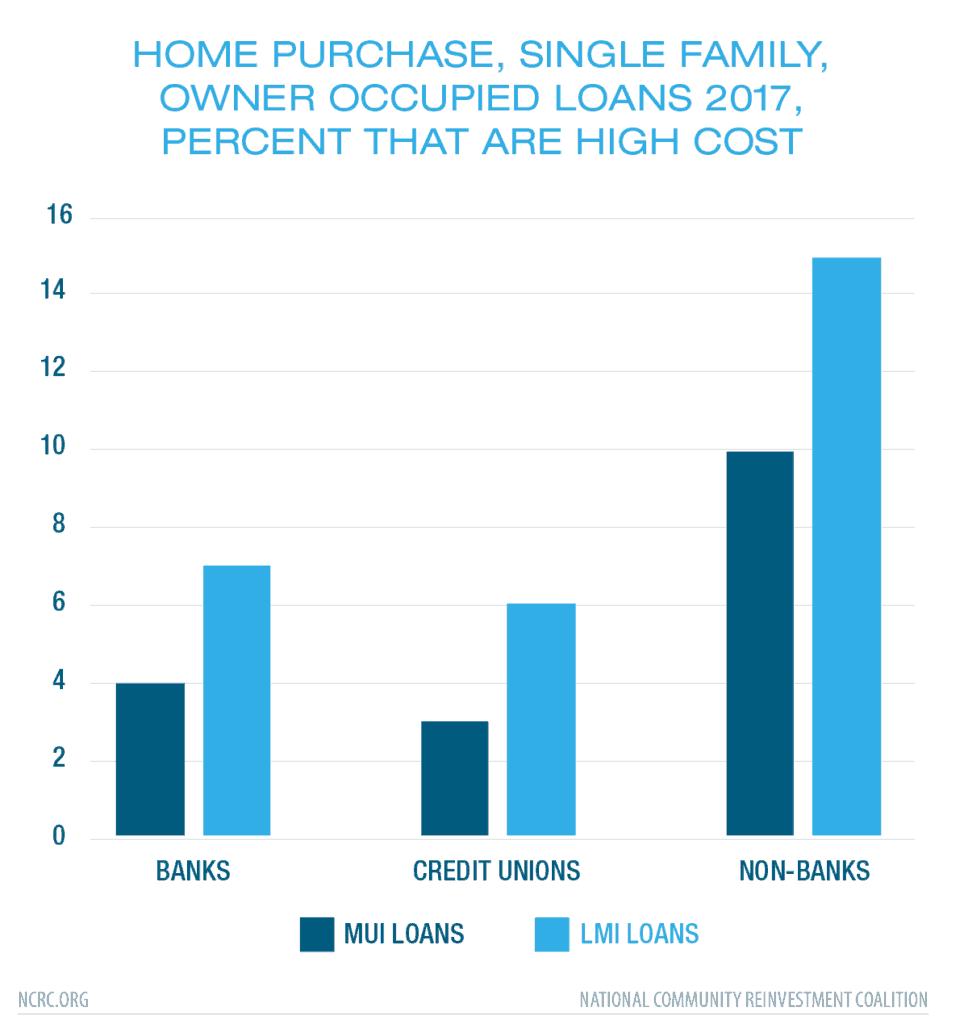
Non-bank LMI and MUI lending is consistently more likely to be high cost than bank or credit union lending. This pattern holds whether we look at all loans or narrow down the selection to just home purchase lending involving owner-occupied homes.
The reliance of non-banks on government-insured lending would be the obvious answer to this disparity. Indeed, the higher cost disparity among lender types disappears when looking at conventional home purchase loans to owner-occupied, single family properties.

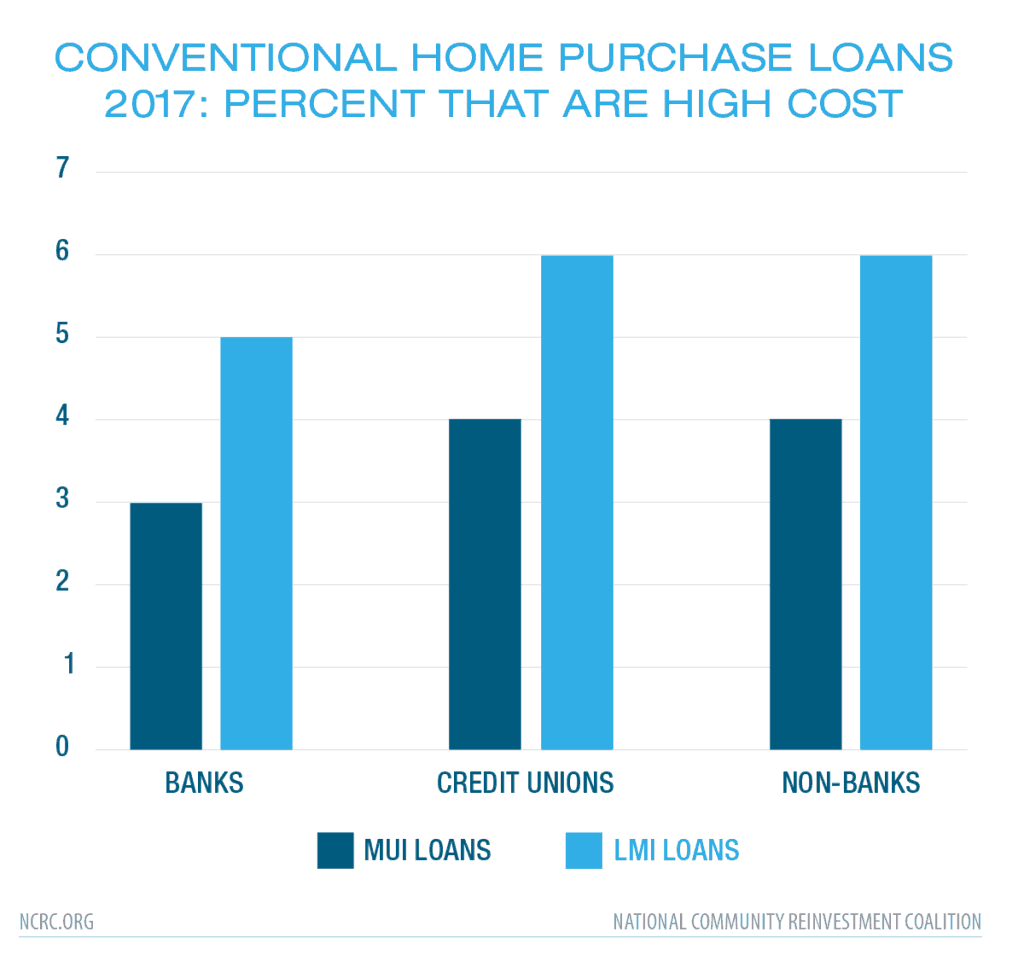
However, were the use of government loans to be solely responsible for the higher rate of high-cost lending on the part of non-banks, we would expect the incidence of high-cost government lending to also be similar for banks, credit unions and non-banks.
Instead, we see a radically different price variation in government-insured lending.
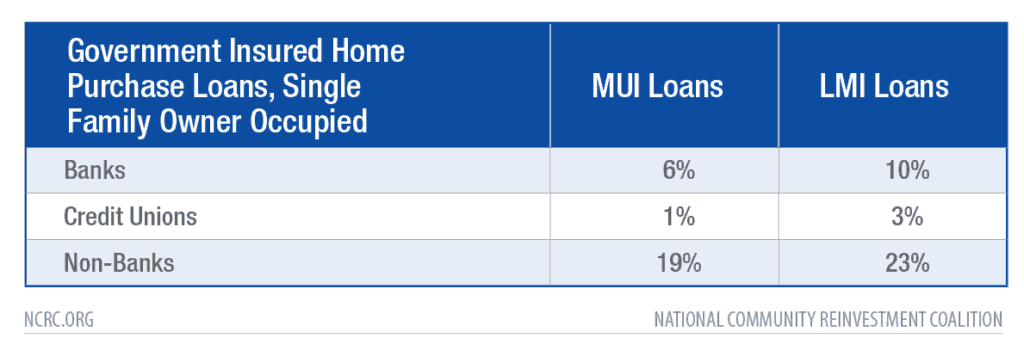
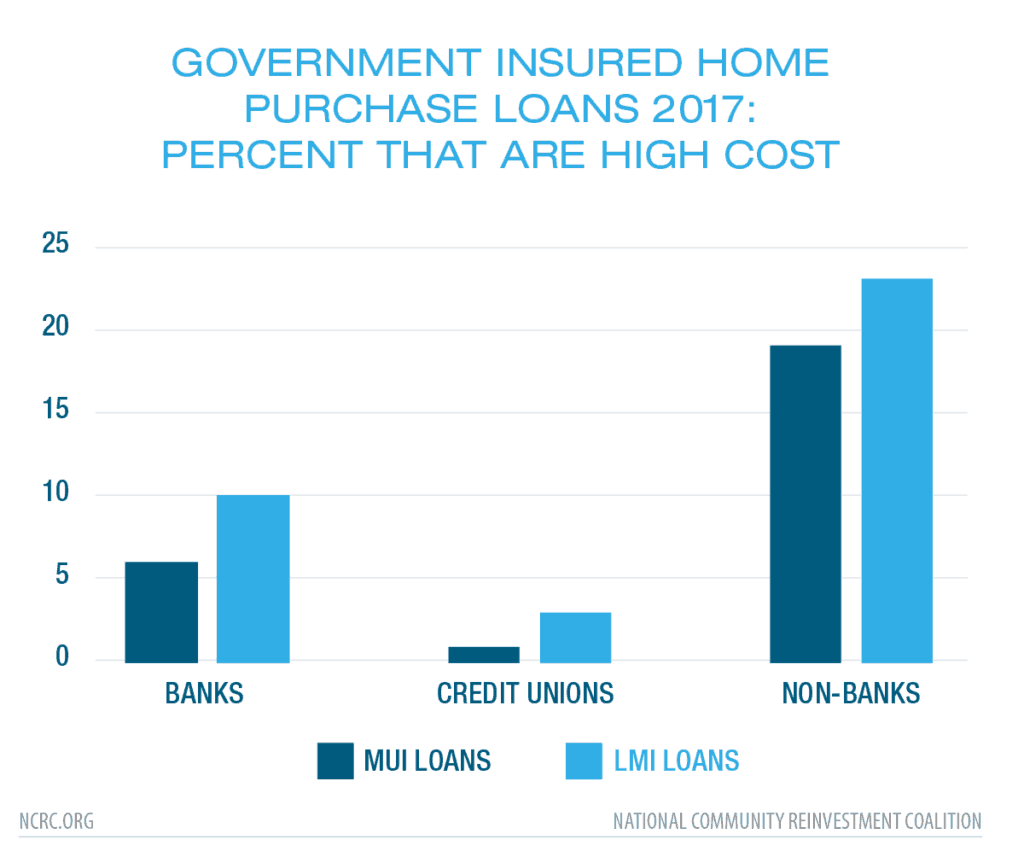
Government insured LMI loans by non-banks were higher cost 23% of the time, over twice as often as LMI loans made by banks. Even for MUI loans, the bank versus non-bank disparity is very high, with non-banks reporting 19% and banks reporting only 6% of their government-insured MUI loans as high cost.
Conclusion
By determining that non-bank lending was much more likely to be high cost to LMI and MUI borrowers and census tracts than bank or credit union lending, we want to encourage policymakers and stakeholders to assess ways to reduce these disparities.
In particular, fair lending and consumer compliance reviews should assess whether the incidence of high-cost lending by non-banks can be reduced and also ensure that there are no racial disparities caused by price discrimination.
Jason Richardson is Director of Research and Evaluation; and Josh Silver is Senior Advisor at NCRC


