


The nation’s bank branch network changed little compared with the first three months in the second quarter of 2026, with 261 openings and 248 closings. This is the third straight quarter of net gains in branches, something that we haven’t seen since 2009. It has been a long time since we could say bank branches were growing in this country. 17 years ago, the Great Recession ended seven years of continuous branch growth.
However, it is undeniable that in some parts of the country banks see a reason to expand their physical presence. This runs contrary to the conventional wisdom that physical bank branches were no longer relevant to consumers. It appears that in high growth metros banks find that physical locations are critical to their plans.
Three of the country’s eight regions – including the Southeast, the Southwest and the Rocky Mountain states – are adding branches, while the other five – including the Mideast and Northeast – are losing branches, with the losses being concentrated in a handful of large metro areas.
Some areas of the country are seeing growth while others continue to see branch closures
Table 1 shows the net change in bank branches across the country’s eight regions since the second quarter of 2026. It highlights the outsized role the Southeast plays in the country’s return to branch growth.
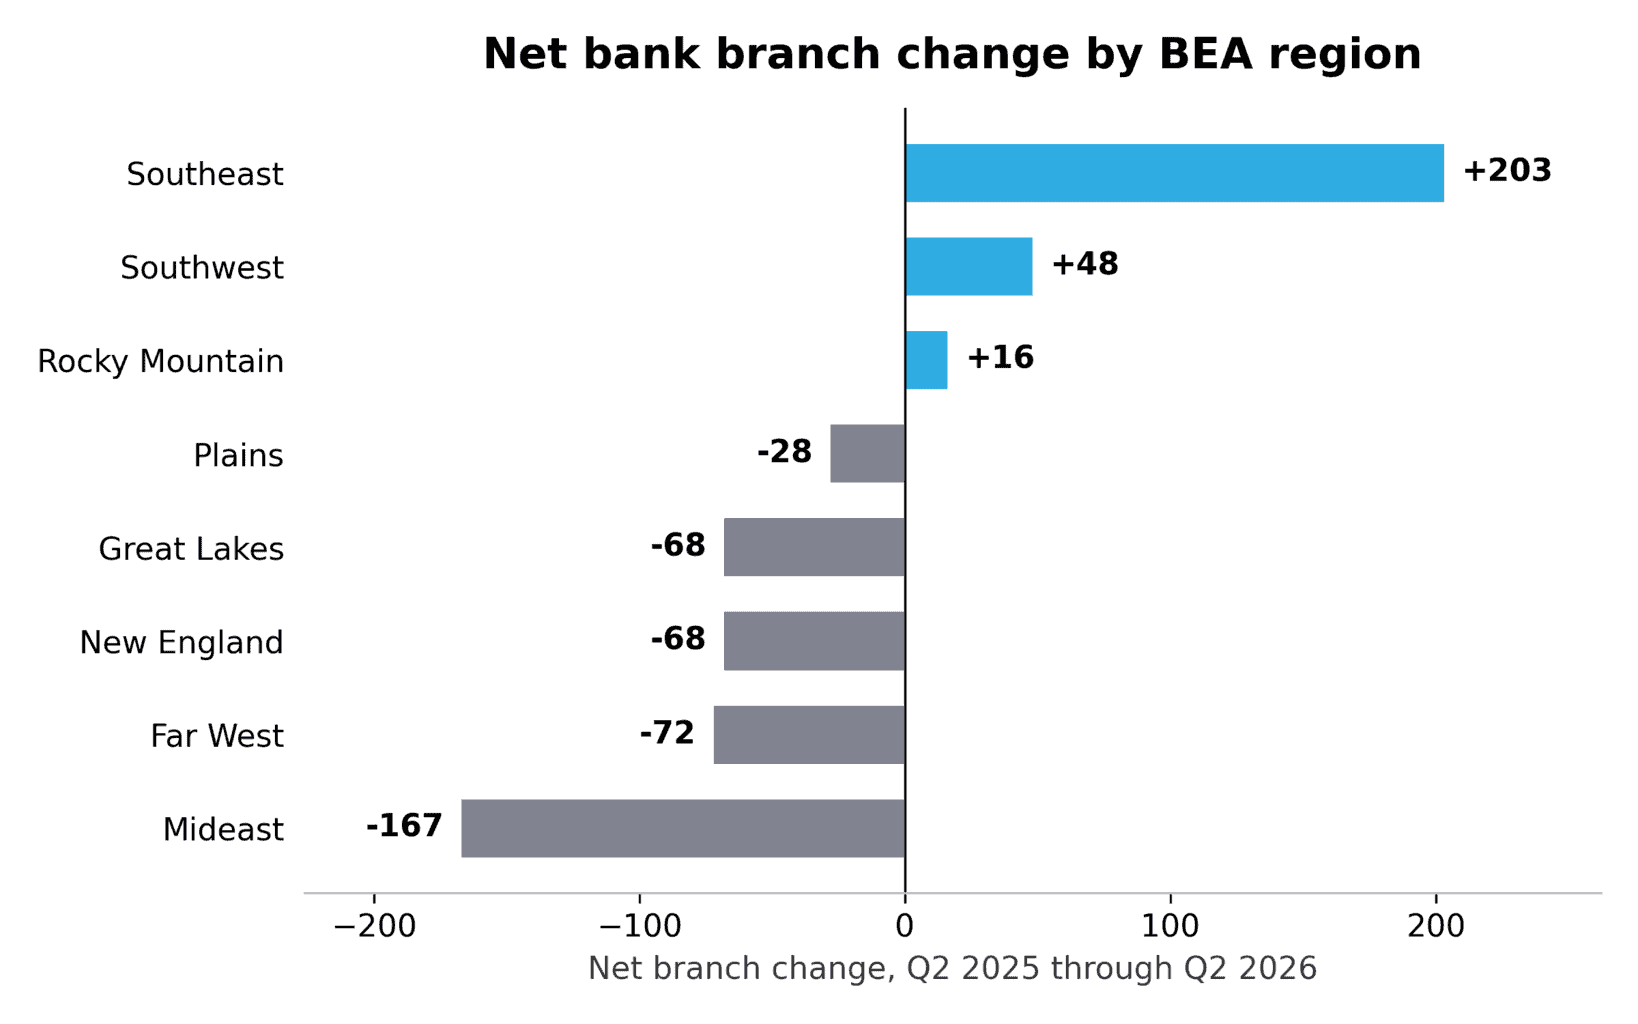
The Southeast is the clear driver of the national total, with the Southwest and the Rocky Mountain states also seeing positive branch growth. On the other hand, the Mideast – including New York, New Jersey and Pennsylvania together with Delaware, Maryland and Washington, DC – is losing branches faster than any other region in the country. However, it is not that simple, with Sunbelt cities in certain states outperforming every place else.
Growth concentrates in a handful of Southeast and Southwest states
Table 2 shows bank branch trends in the Southeast and Southwest regions by state. It shows that branch expansion is not spread evenly across the region as Florida and Texas account for roughly half of the combined gain alone.
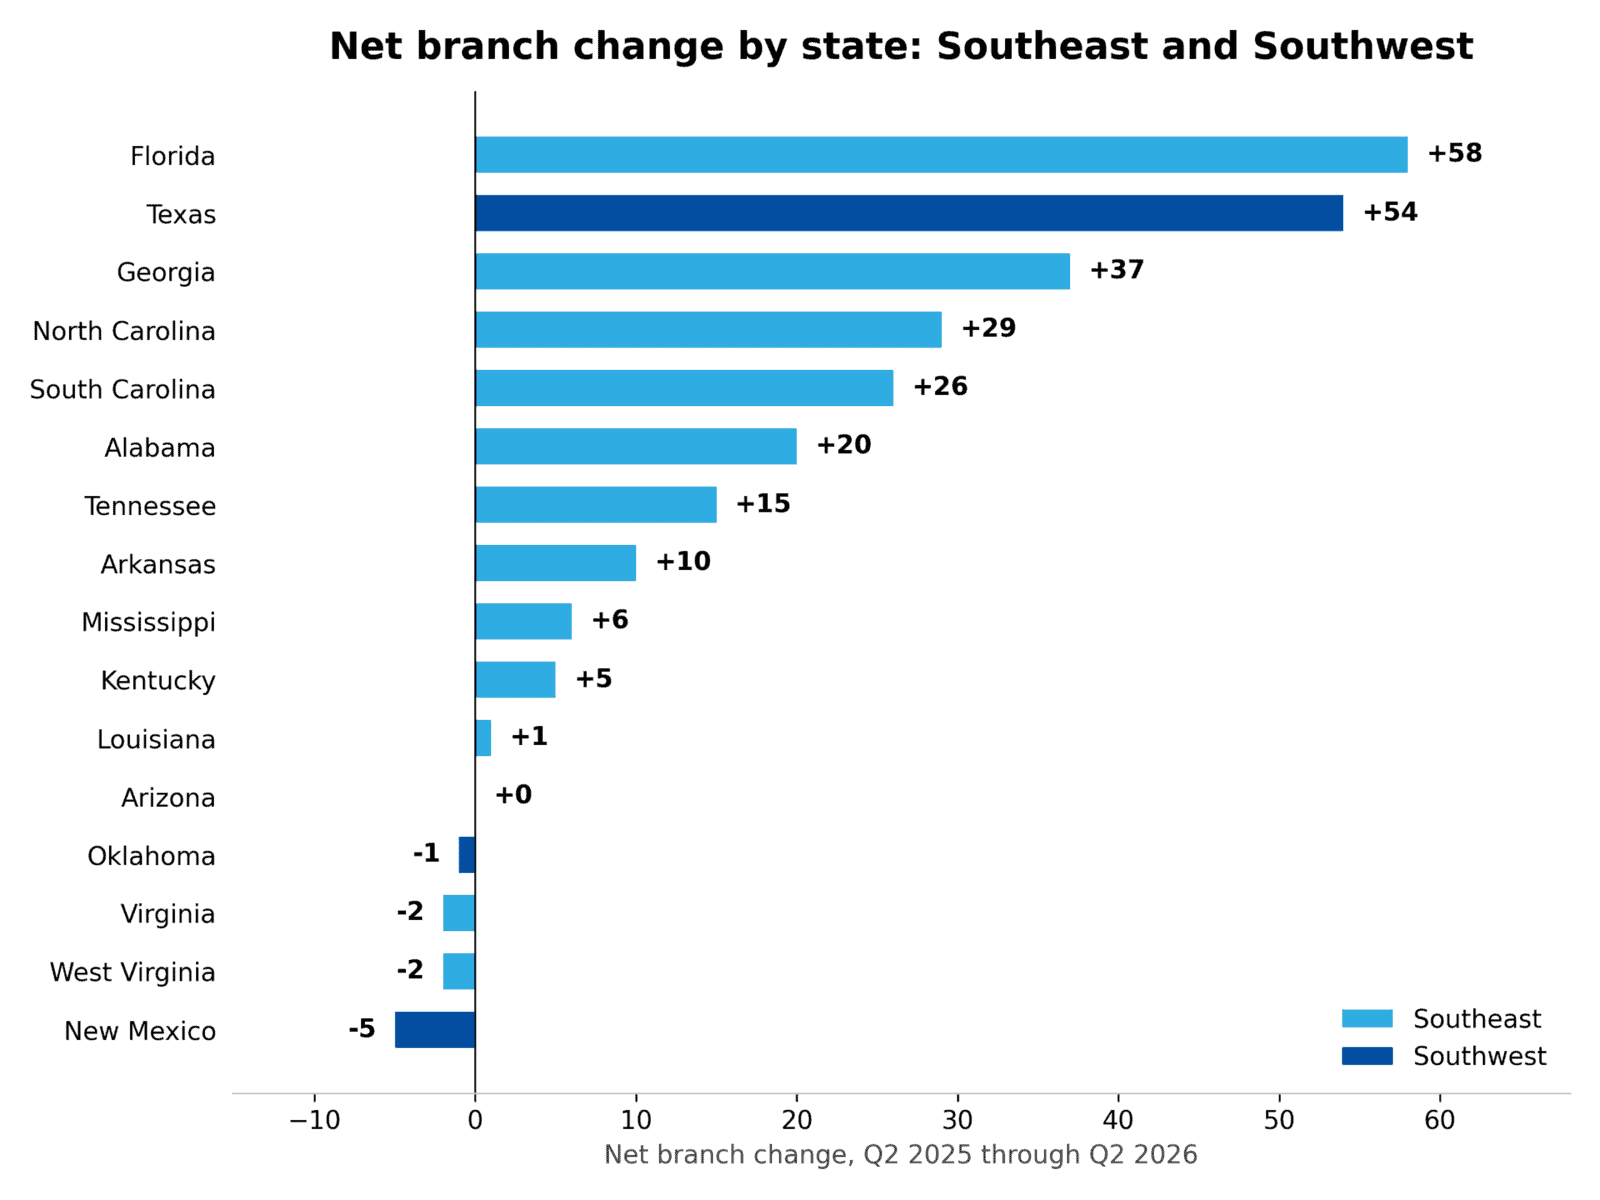
Florida and Texas account for a large share of the combined growth across both regions, more than the next several gaining states put together. Georgia, the Carolinas, Alabama and Tennessee round out a cluster of Deep South and Gulf Coast states that added branches in every quarter. Virginia and West Virginia, both a part of the Southeast under this framework, saw essentially no branch growth. Outside of Texas, the rest of the Southwest experienced flat to slightly negative growth, with Arizona showing no change and New Mexico actually losing branches.
New York’s losses are a story about scale, not decline
Table 3 shows the ten metro areas with the largest net branch change over the same five quarters. It shows that both the gains and the losses are concentrated in a small number of metro areas rather than spread broadly across the country.

Dallas-Fort Worth, Atlanta, Miami, Charlotte, Austin and Nashville lead the metros that reported a net gain in branches, with more branches opening than closing. The New York metro’s branch network is by far the largest in the country, more than three times the size of Boston’s or Philadelphia’s. On a percentage basis, New York’s decline was actually smaller than Philadelphia’s or Detroit’s over the same window, and roughly in line with Boston’s. However, the concentration of losses in a handful of legacy Northeastern and Midwestern metro areas is the most notable pattern.
Growth is happening for full-service branches, not in-store locations
Table 4 shows net branch changes by service type (full-service brick-and-mortar branches versus in-store/retail locations, such as those inside a supermarket or big-box store) and how they are split between the Southeast and Southwest regions compared to the rest of the country. It shows that growth, even in the fastest-growing markets, is happening via brick-and-mortar branches rather than in-store locations, the latter of which are shrinking everywhere.

Even in high growth markets, in-store and retail branches are also shrinking in number. Nationally, only 19 new in-store or retail branches opened over the entire five-quarter window compared with 96 that closed, a pattern that held firm in every quarter regardless of whether the broader branch count was growing or shrinking. Full-service brick-and-mortar branches account for the overwhelming majority of new openings everywhere, suggesting the in-store banking format is being wound down as a category rather than relocated to high growth markets.
Banking trade press coverage points to a straightforward explanation: in-store branches were built to provide transactional convenience for customers who were already at the store for something else. Online and mobile banking have eliminated most of the reason for that kind of interaction since routine transactions no longer require showing up in person at all. When customers do still need to visit a branch, recent reporting on bank branch strategy suggests they prefer a full-service location better suited to private conversations about banking needs rather than a retail store built for foot traffic.
The regional split lines up with where money and higher earners are moving
For banks, their branch strategy is a business decision made for many reasons that this data cannot pinpoint, but the geography trends outlined in this article line up closely with outside migration research. Demographic analysis published by Brookings Institute has tracked domestic out-migration from large coastal metro areas, including New York, Los Angeles, San Francisco, Boston and Seattle, alongside sustained in-migration to Sun Belt metro areas, such as Dallas, Tampa and Raleigh, since the early part of the pandemic. The same research found that a lot of what looked like a population rebound in big metro areas in 2023 and 2024 was driven mainly by a rise in immigration from abroad rather than a reversal of domestic migration rates. The newest available analysis on this migration found that metro population growth is declining again as immigration slows.
IRS migration data, which tracks income rather than head counts, shows the steadier pattern of growth behind the population volatility. The most recent filing-year data available covering 2022 to 2023 shows Florida gaining more than $20 billion in net adjusted gross income from interstate migration and Texas gaining more than $5 billion, while California, New York, Illinois, Massachusetts and New Jersey experienced the largest net losses. This state-by-state pattern matches this article’s branch findings closely, with the same handful of states gaining income being the ones gaining bank branches. New York, despite an overall population that has recovered in recent years due to immigration, continues to lose more income to domestic migration than nearly any other state, which is consistent with its outsized share of branch closures.
A note on data revisions
The figures in this article reflect the FDIC’s BankFind Suite structural change data as of the article’s publication date. Banks sometimes file branch opening, closing and relocation records after the quarter has ended, with FDIC assigning these filings a processing date that can fall months after the effective date of the change. As a result, figures for a given quarter can shift in later reports as additional filings are processed. This article reflects the most current data available and updates the prior quarter’s figures accordingly. The five-quarter window shown here has been refreshed against the newest available data pull, which includes revisions to the third and fourth quarter of 2025 and the first quarter of 2026. Readers comparing figures across published analyses should accept small revisions to prior quarter counts as a part of normal data processing, not as corrections to the overall methodology.
Methodology note: Figures cover FDIC-insured institutions’ full-service branch locations (brick-and-mortar and staffed retail/drive-through) based on FDIC’s OSCR structural change filings for the quarter shown. Regional definitions follow the U.S. Bureau of Economic Analysis’s eight-region scheme rather than the Census Bureau’s four-region scheme.
Jason Richardson is the Senior Director of Research with NCRC’s Research team.
Photo credit: Monstera Production via Pexels.
