Defining African American
Though a term that has personal meanings and different connotations for many, “African American” is defined by the U.S. Census as “a person having origins in any of the Black racial groups of Africa,” and used synonymously with the simple term “Black.” These African roots can be found in an array of origins and experiences including North America, South America and the Caribbean. Most Black folks in the America’s can trace their genealogy to enslaved ancestors, forced into the trans-Atlantic slave trade that started in the early 17th century. To this day, Blacks in the United States continue to face institutional barriers and discrimination, including a growing racial wealth divide.
Demographics
There are over 47.8 million African Americans residing in the United States, with the largest Black population found in Texas, with about 3.3 million (11.7% of the state population). Texas is followed by Georgia with 3.2 million African Americans (31% of the state population) and Florida is third, with 3.17 million African Americans (15.4%). In terms of racial concentration, the highest percentage of African Americans were found in District of Columbia, where the population is 46% Black. Mississippi follows, with a population that is 37.5% Black, while Louisiana is third with a population that is 32% Black. Georgia has the fourth largest concentration of African Americans, with a population that is 31% Black. The South is home to 55% of the total African American population, while the Northeast has 18%, the Midwest has 17% and there is 10% in the West.[1]
Income
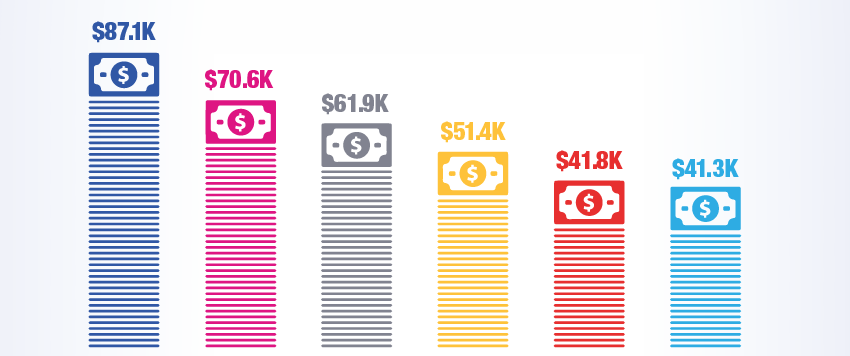
Though the African American population continues to rise, incomes do not reflect the increasing demographics. In 2018, the annual median income of African Americans reached $41,361, which is below the national average of $61,937, and far below the White median income valued at $70,642.[2] The disparities continue when comparing African Americans with Asian American households who earn an average of $87,194, and with Hispanics who earned a median income of $51,450. In 2018, median income for Native Americans was estimated to be $41,882, comparable to the median income of African Americans; thus making the two groups the lowest earning races.
Poverty Rates
According to the U.S. Census, around 21% of African Americans live below the poverty line, compared to an overall poverty rate of 11.8%. Poverty rate disparities are exacerbated when compared across racial lines. Only about 10% of White Americans and Asian Americans live below the poverty line— a poverty rate half that of African Americans. 17.6% of Hispanics live below poverty,[3] while Native Americans have the highest poverty rates, with 25.4% living below the poverty line.[4]
Employment and Unemployment
The Bureau of Labor Statistics[5] reported a national African American unemployment rate of 6.5%, mirrored very closely by Native American unemployment at 6.6%. This level of unemployment for African Americans is at a record low nationally. Yet, there are still substantial disparities when compared with other racial groups. The national unemployment rate is just 3.9%. White Americans have an unemployment rate almost half of African American’s at 3.5%, while Asian Americans have the lowest unemployment rate at 3.0%.
Educational Achievement
Education levels have been on the rise for African Americans. High school completion rates have been increasing since 2010, during which graduation rates for African Americans were 67%. In 2017, graduation rates reached 78%, totaling an 11% increase in high school graduation rates from 2010 to 2017.[6] This was the largest improvement in graduation rates among racial groups. Postsecondary educational attainment also increased from 2010 to 2017; attainment of a bachelor’s degree or higher increased from 17.5% to 21.6%.[7] Though a near 22% bachelor’s attainment rate and an 88% high school graduation rate for African Americans mark strong progress, there is still great disparity with White Americans who have a bachelor’s attainment rate of 36% and a high school graduation rate of 93%.
Wealth
Income and employment only display partial components of economic well being. Wealth levels account for total debt, financial assets such as investment funds and nonfinancial assets such as residential property ownership. Thus, net worth is a broader depiction of wealth, and starkly highlights the racial wealth divide. While White households have a median family net worth of $147,000, Black households have a median family net worth of a mere $3,600. In other words, the median White family has 41 times more wealth than the median Black family.[8] Much of this can be attributed to disparities in homeownership, as housing is known to make up two-thirds of a typical household’s wealth. Access to quality jobs and residing in asset rich neighborhoods are also key to boosting the financial security of African American households.
[2] United States Census Bureau, Current Population Survey, 2018 and 2019 Annual Social and Economic Supplements.
[3] United States Census Bureau, Current Population Survey Annual Social and Economic Supplements (CPS ASEC)
[4] United States Census Bureau, 2017 American Community Survey, 1-Year Estimates.
[5] U.S. Bureau of Labor Statistics, Labor Force Characteristics by Race and Ethnicity, 2018.
[6] National Center for Education Statistics, Public High School Graduation Rates.
[7] United States Census Bureau, 2010 & 2017 American Community Survey, 1-Year Estimates.
[8] Collins, Hamilton, Asante-Muhammad, Hoxie. Ten Solutions to Bridge The Racial Wealth Divide, April 2019. Institute for Policy Studies.


