


Definition of Terms
Asian Americans (AA) are a diverse group of individuals. The US Census defines Asian American as someone originating from the Far East (i.e., China, Indonesia, etc.), Southeast (i.e., Cambodia, Laos, Vietnam, etc.) or the Indian subcontinent. The 41 groups within the broader AA umbrella don’t fall neatly into national categories, such as Okinawans in Japan and the Hmong from Chinese descent. Additionally, the Census specifies demographic data by the category of “alone” for a person that is counted as only one racial or ethnic group or as “alone or in combination” for a person who identifies with more than one racial or ethnic group.
Demographics History
Changes to US immigration law have shaped the demographic history of Asian Americans. The California Gold Rush and western railroad construction in the mid-1800s brought thousands of Chinese laborers, and smaller numbers of Japanese and other Southeast Asian migrants, to the West Coast. This early period of immigration concluded with the Chinese Exclusion Act of 1882. Legal pathways for immigrating to the US were becoming increasingly restrictive with the passage of the Immigration Acts of 1917 and 1924. The former barred immigration from virtually all of Asia and the latter created a racial quota system that limited the number of immigrants who could enter the country from the continent.
The Immigration and Nationality Act of 1965, which ended the restrictive racial quota system, marks the start of the large-scale arrival of Asian immigrants. The act replaced national origin restrictions with skills-based preferences, which brought waves of Indian, Pakistani, Chinese and Filipino immigrants. The Indochina Migration and Refugee Assistance Act of 1975 also provided a pathway for Vietnamese, Hmong, Cambodian and other Southeast Asian refugees to come to the United States.
The different circumstances under which Asian Americans immigrated to the United States are visible in differential socioeconomic outcomes detailed later in this snapshot. Additionally, demographic differences between AA subgroups, such as language and education, contributed to who was able to come to the United States. For instance, the introduction of skills-based immigration pathways combined with a large population of English-speaking professionals is partly why today Indian Americans are the largest Asian American subgroup given their surplus of citizens who meet both requirements.
The Census Bureau counted 1.5 million Asians and Pacific Islanders in 1970, which rose to 3.7 million in 1980 and to 7.3 million by 1990. However, the Bureau cautions that part of that growth reflects changes in the Census’ race categories rather than a true spike in population for these groups. In 1970, there was no Asian category at all. The Census counted Japanese, Chinese, Filipino, Korean and Hawaiian as separate races, classified Asian Indians as White and placed Vietnamese under “Other race,” with no option to report more than one race.
In 1980, Asian Indian and Vietnamese were included in separate categories. In the 2000 Census, Asian Americans, Native Hawaiian and Pacific Islanders were separated into two categories. The 2000 Census also allowed respondents to record more than one racial category for the first time. In the 2000 Census, 10.2 million self-identified as Asian alone, which climbed to 14.7 million by 2010. Today, 19.9 million, or 5.95% of the population, identify as Asian American alone.
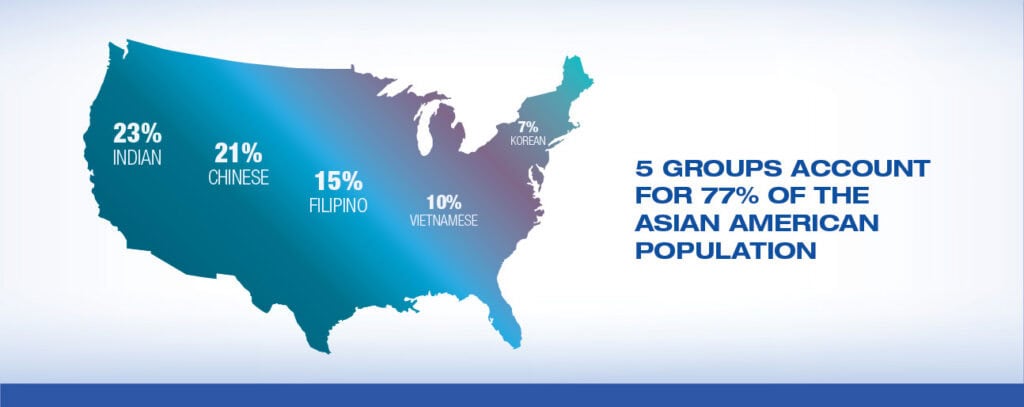
The chart below shows that about three quarters of the Asian American population consist of just five groups:
Those five groups include Indian Americans, who account for almost a quarter of the total population share, and Chinese Americans, who account for over a fifth of the total Asian American population. The three remaining groups (Filipino, Vietnamese and Korean) all have totals over 1 million.
The states of California and Hawaii played an important role in the history of Asian American immigration. Given their proximity to Asia, both states have become top destinations for Asian Americans. California has the largest number of Asian-alone persons at 6.1 million. Hawaii is the only state with a majority Asian (for those classified as “alone or in combination”) population, which currently sits at 57% of the total Hawaiian population.
The chart below shows that three states (California, New York and Texas) contain almost half of the total Asian American population:
Wealth Accumulation in Communities
The Survey of Consumer Finances, the premier dataset for measuring household wealth in the United States, measured Asian Americans separately for its 2022 release for the first time. They found that the median Asian American household held $536,000 in net worth – the highest of the racial groups surveyed. However, this figure masks the large level of wealth inequality between Asian American subgroups.
There are no national surveys that examine wealth among Asian American subgroups. However, a 2016 report from the New School found that the median household wealth of Korean Americans living in Los Angeles was $23,400. Their Japanese counterparts in Los Angeles held $592,000 in median household wealth. This is nearly a 25 to 1 ratio difference, indicating how large disparities exist between Asian American subgroups.
Similar to income inequality, wealth is distributed unevenly across Asian American groups. The intra-group wealth inequality stems from the effects of the different immigration paths among Asian Americans. As noted in the demographics section, some groups have arrived in the United States already highly educated via skills-based visa pathways while others came over as refugees with less financial resources.
Asian Americans have an overall homeownership rate (62.7%) that is around the national average (65%). However, similar to overall wealth rates, homeownership is distributed unevenly among Asian Americans. The homeownership rate varies widely, from 56% for Korean Americans to 69.6% for Vietnamese Americans.
Asian American households have a higher stock ownership rate (38%) than White households (24%), the highest of all racial groups. Business ownership is an important source of wealth for AA households, with about 15% reporting having business assets.
Rates of Educational Attainment
Asian Americans as a group have the highest level of educational attainment amongst all racial and ethnic groups in the United States. 56.7% of AAs have attained a bachelor’s degree or higher. However, vast differences in educational attainment among Asian American subgroups exist.
For example, while 80.6% of Taiwanese Americans have a bachelor’s degree or higher, only 52.6% Filipino Americans have obtained at least a bachelor’s degree. Similar differences exist for overall college enrollment rates as well. For example, 28.5% of Japanese Americans are enrolled in college compared to 37.6% of Chinese Americans.
Educational attainment differs by Asian American subgroup as shown in the chart below:
There are also sizable educational attainment differences between immigrants and US-born Asians. For example, 59% US-born Vietnamese adults have a bachelor’s degree compared to only 29% of foreign-born Vietnamese. Similarly, 54% of foreign-born Chinese Americans have at least a bachelor’s degree compared to 70% of US-born Chinese Americans.
Income Levels Across Groups
Asian Americans have the highest median household income of all racial and ethnic groups at $121,700. Similar to the aforementioned educational and demographic statistics, there are vast differences among AA subgroups. Indian Americans, the largest Asian subgroup, have the largest median household income ($165,721). This is over twice as much as Bangladeshi Americans ($76,365) and over 50% higher than Chinese Americans ($108,626), the second largest Asian sub-group.
These income differences are shown in this chart:
Within and between Asian American subgroups, vast disparities exist between the highest earnings and the lowest earnings. To gain a clearer sense of the intra-group income inequality that exists between AA subgroups, one can use the 90/10 ratio, the ratio of the top 10% of household income to the bottom 10%. A ratio of 20 means that households in the top 10% of earners have 20 times the income as households in the bottom 10%. For Chinese Americans, the ratio is 19.2 compared to 9.8 for Indian Americans. While the ratio for both groups was virtually identical in 1980, the former has shot up by 10.9 by 2022 compared to only .8 for the latter.
The intra-subgroup disparities can be partly explained by nativity, meaning native-born households have higher incomes than their newly arrived immigrant counterparts. For example, among immigrant-headed, Korean American households, their overall income was $82,000 versus $104,900 for US born-headed Korean American households.
While typically, US born Asian American households had higher incomes than immigrant-headed households, this is not true for Indian Americans. Immigrant-headed Indian American households have higher incomes ($156,000) than their US-born Indian American counterparts ($120,200). This stems from the fact that US and foreign-born Indian Americans have nearly identical rates of educational attainment. As the demographics section detailed, this trend is a byproduct of the skills-based immigration pathways many Indian Americans have been able to access.
Work and Labor Trends
A notable labor trend for Asian Americans is the high percentage who work in managerial and professional occupations (57.2%). This stems from their aforementioned higher educational attainment rates. Another unique trend is their relatively low unemployment rate (2.8% in 2022), compared to the overall population (3.6%). Even across the major Asian American subgroups, the unemployment rate is low, including 1.8% for Japanese Americans and 2.7% for Indian Americans.
The distribution of occupations and industries that Asian Americans work in are shown below:
However, there is a substantial group of Asian Americans who are low- and moderate-income, with occupational segregation, the over-representation of one group in an occupation, being common for some Asian Americans. For example, Asian women without a college degree are more likely to work in occupations that manage beauty, fitness and other personal needs of clients.
Workers in these occupations, such as manicurists, housekeepers and home health aides, are at the greatest risk of being misclassified as independent contractors. This results in workers having overtime protections stripped from them, the inability to access unemployment insurance and fewer legal avenues to collectively bargain for better working conditions and form unions.
Contents
Racial Wealth Series
Subscribe
Get NCRC news and
alerts by email.
